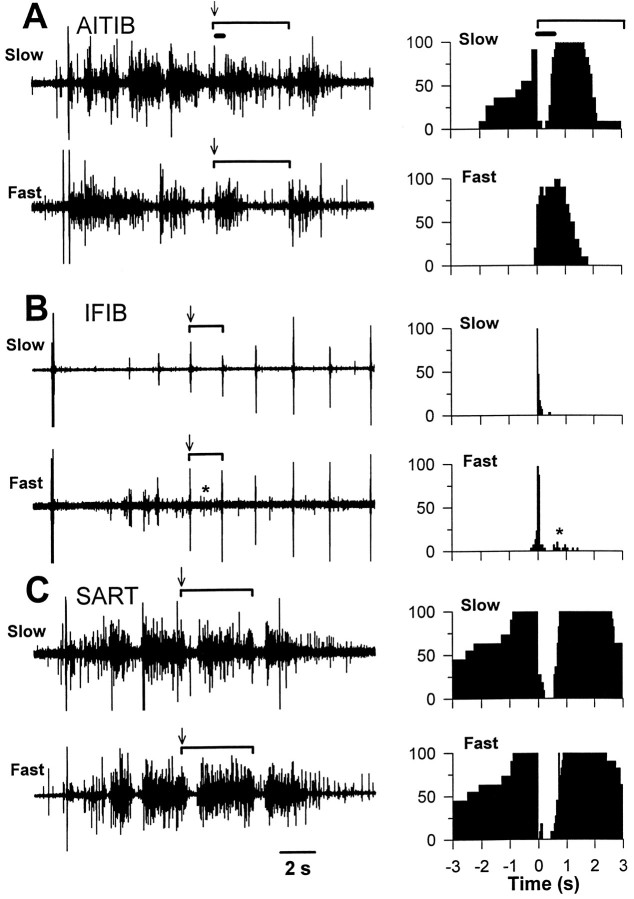
Fig. 9.
EMG activation patterns recorded simultaneously from fast and slow muscle regions in three stage 36 embryos. In anin vitro spinal cord–hindlimb preparation, a single electrical stimulus to the thoracic cord elicits a series of motoneuron bursts or cycles (see Results for more detail). The EMGs for fast and slow muscle regions of the AITIB, IFIB, and SART are shown on the left. The extent of one cycle in each EMG is marked by a bracket,arrows mark cycle onset, and the thick horizontal bar in A indicates an inhibitory period just after cycle onset that is characteristic for this muscle. All EMGs have the same time base shown by the calibration bar at the bottom of the figure. The histograms to the right, which combine data from a number of cycles, show the probability of a pool being active at different phases of the step cycle. In the histograms, the onset of the cycle is indicated by the 0 time point in the graph. Thebracket marks a cycle; the thick horizontal bar indicates the inhibitory period. A, The fast and slow regions of the AITIB were differentially activated by the central pattern generator. The slow region (top trace) was activated in a flexor-like pattern. It was active before cycle onset, became quiescent for ∼400 msec (thick horizontal bar) after cycle onset (arrow), and then resumed bursting. In contrast, the fast region (bottom trace) was extensor-like and burst for a shorter period beginning at the onset of a cycle (arrow). Histograms (right) for each region show the probability of activation at any time in the cycle (0 marks cycle onset).B, The fast and slow regions of the IFIBwere also differentially activated. Both regions exhibited a brief synchronous activation at the onset of each cycle (arrows). In addition, the fast region (bottom trace) but not the slow region (top trace) was frequently active again (asterisk) after a period of quiescence. The adjacent histograms show graphically the probability of activation during any point in the cycle (0 marks cycle onset).C, In striking contrast to the AITIB andIFIB, there was no detectable difference between the activation patterns of the fast and slow SART regions.Arrows in EMGs mark cycle onset. Histograms (right) show the probability of activation of theSART muscle during a cycle.

