
Fig. 1.
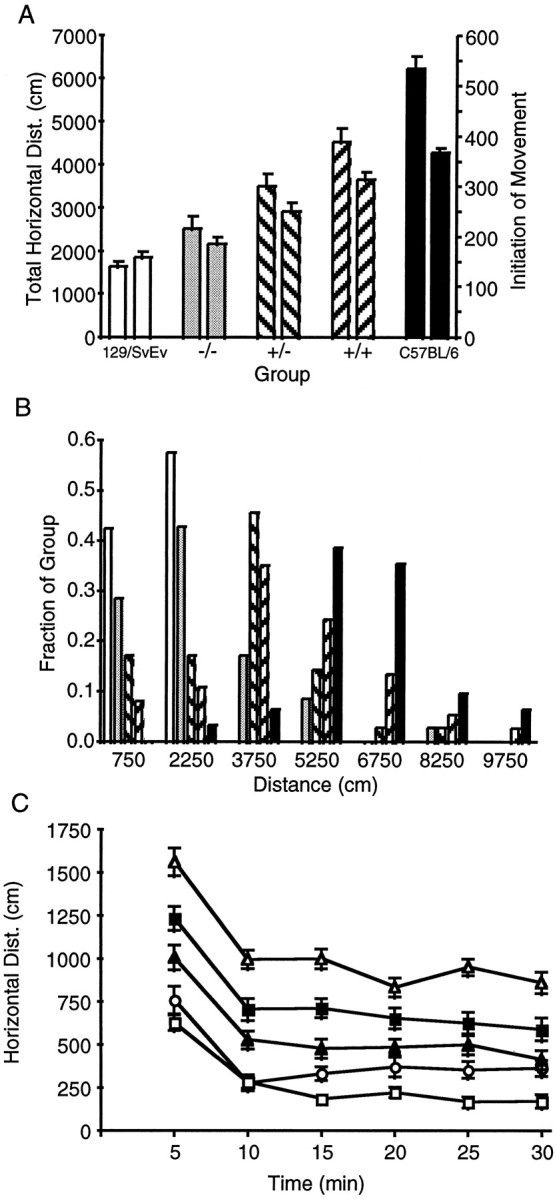
Locomotor activity in drug-naive F2 hybrid D2 receptor mutant mice and the wild-type parental strains. A, Total horizontal distance traveled (left) and initiation of movement (right) over 30 min in a novel open field. Data are mean ± SEM.White bars, Wild-type 129/SvEv (n = 35); gray bars, F2−/− (n = 36); diagonal right bars, F2+/− (n = 36); diagonal left bars, F2+/+ (n = 37); andblack bars, wild-type C57BL/6 (n = 32). For statistical comparisons, see Results. B, Frequency distribution histogram of total horizontal distance. The fraction of each group scoring within a specified range is plotted. Bin width is 1500 cm, such that the first bin represents mice scoring from 0 to 1500 cm centered on 750 cm. Groups of mice are the same as inA. C, Time course of horizontal activity in the open field during 30 min. Data are plotted as distance traveled ± SEM in each time block of 5 min. p< 0.0001; F2−/− compared with F2+/+ mice, ANOVA followed by Tukey post hoc analysis. Open squares, Wild-type 129/SvEv; open circles, F2−/−; shaded triangles, F2+/−; shaded squares, F2+/+;open triangles, wild-type C57BL/6.