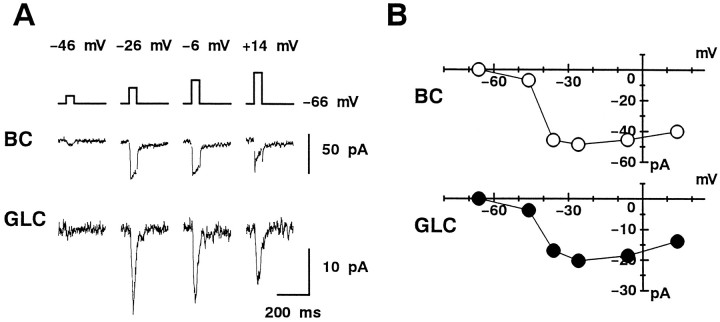
Fig. 3.
Relationship betweenICa in a bipolar cell and the evoked postsynaptic current in a GLC. A, A bipolar cell was depolarized from the holding potential of −66 mV to various command voltages for 50 msec (top trace). During depolarization,ICa (middle trace) was activated in the bipolar cell, and the evoked postsynaptic current (bottom trace) was observed in a GLC, voltage-clamped at −76 mV. B, The peak amplitude ofICa (top graph, open circles) and the peak amplitude of the evoked postsynaptic current (bottom graph, solid circles) were plotted against the command voltage applied to the bipolar cell.

