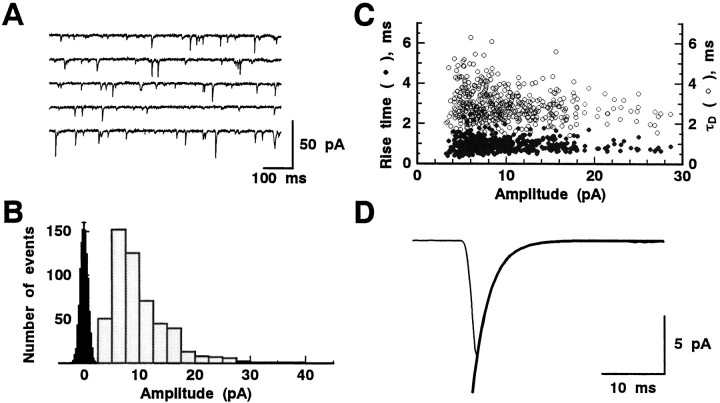
Fig. 6.
Characteristics of spontaneous EPSCs observed in GLCs. A, Five sets of continuous 800 msec current recordings were obtained from a GLC that was voltage-clamped at −76 mV. B, The amplitude histogram (gray; bin width 2.5 pA) was constructed from 525 spontaneous EPSCs that could be isolated clearly. The amplitude histogram of the baseline noise (black; ± 0.7 pA SD; bin width 0.25 pA) was taken from 10 (100 msec each) sections of the recording that apparently were devoid of the spontaneous events. The peak was set to match the peak of the spontaneous EPSC amplitude distribution. C, Rise times (the time required to change from 10 to 90% of the peak amplitude; filled circles) and decay time constants (open circles) were plotted against their peak amplitudes. D, An averaged waveform of the 525 spontaneous EPSCs aligned at their peaks (thin line). The falling phase was well fit by a single exponential function with the decay time constant of 2.6 msec (thick line).

