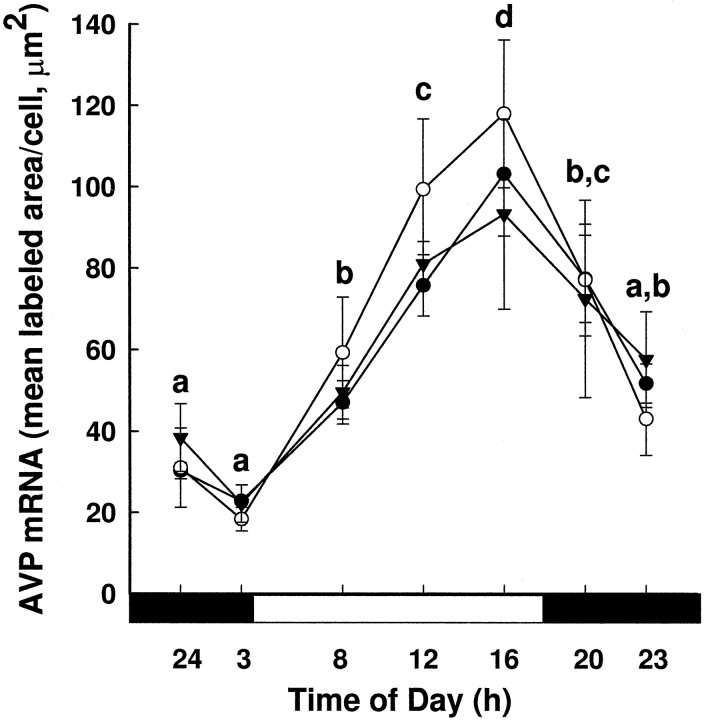
Fig. 8.
AVP mRNA levels per cell (mean ± SEM) over time in young (•), middle-aged (○), and old females (▾). The 3 (age) × 7 (time of day) ANOVA revealed a main effect of time on AVP mRNA levels (F(6,108) = 18.73;p < 0.001), with AVP mRNA levels increasing between 0300 and 1600 hr and then declining to baseline levels by 2300 hr (different letters are significantly different from each other; p < 0.05). The black bar under the x-axis represents the dark phase of the cycle, and the white bar represents the light phase.

