
Fig. 6.
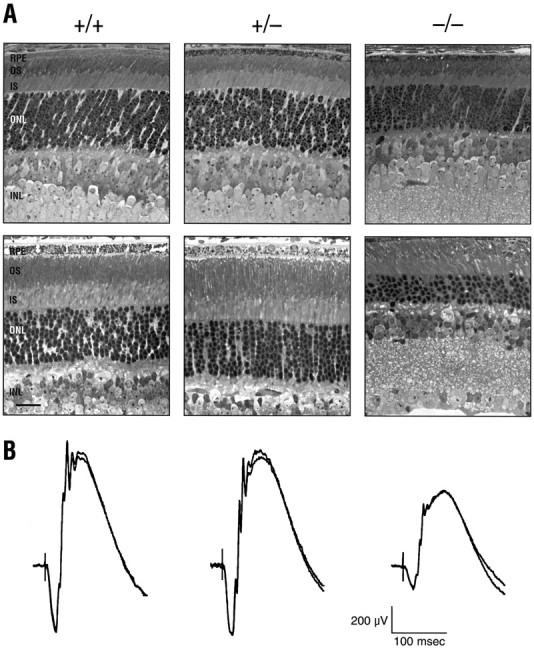
Retinal histology and electroretinography.A, Light micrographs of the midperipheral retina fromIRBP+/+, IRBP+/−, andIRBP−/− mice; the sections are from P11 (top row) and P30 (bottom row) animals. Scale bar, 20 μm. B, Electroretinographic recordings from 1-month-old littermates. The ERG traces were in response to a high-intensity (0.3 log cd sec/m2) flash stimulus delivered to the dark-adapted retina; two successive traces obtained for each mouse are superimposed.