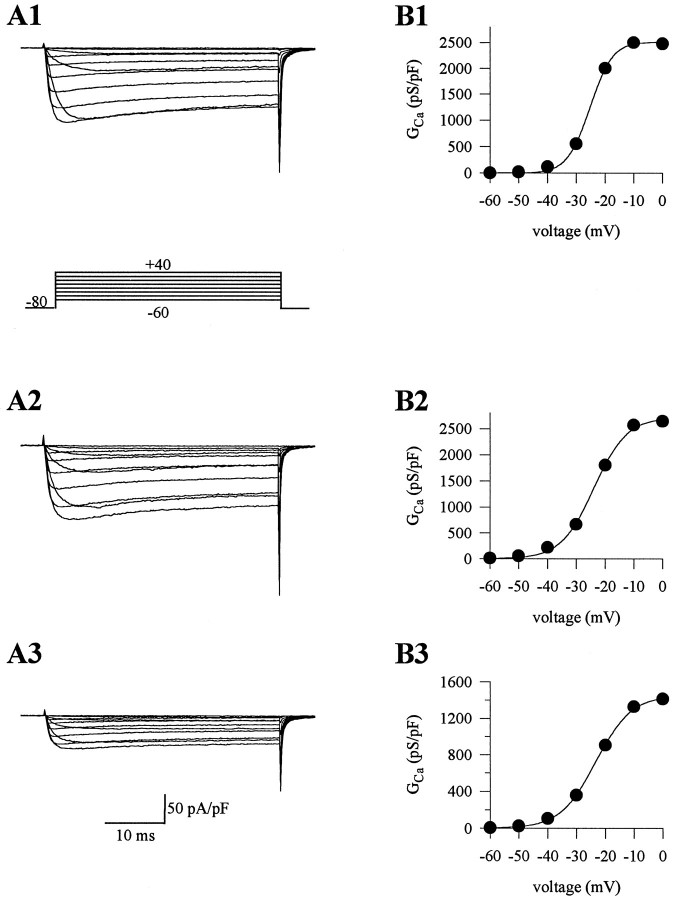
Fig. 1.
Barium currents in Purkinje cells of wild-type and leaner mice. A1–A3, Inward currents elicited by depolarizing voltage steps from a holding potential of −80 mV in wild-type (A1),tgla/+ (A2), andtgla/tgla(A3) cells. Note the difference in current densities between cell types (Ipk for wild-type = −134.3 pA/pF, tgla/+ = −132.7 pA/pF, andtgla/tgla = −70.4 pA/pF). B1–B3, Conductance versus voltage curves plotted from currents in A1–A3. The data were fitted with a single Boltzmann function. The G–V curves had similar half-activation voltages (for wild-type cell,V1/2 = −25.3 mV;tgla/+ cell,V1/2 = −23.9 mV;tgla/tglacell, V1/2 = −23.2 mV). The slope factor of thetgla/tglacurve (6.2) was greater than that for thetgla/+ (5.7) and wild-type cells (3.9).

