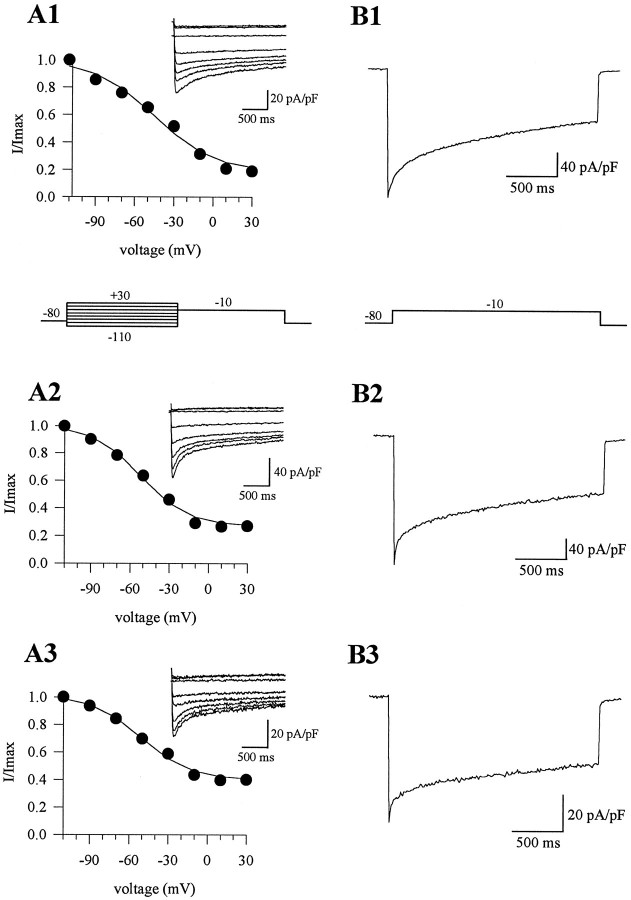
Fig. 2.
Inactivation of barium currents in wild-type andleaner cells. A1–A3, Currents elicited by a two-pulse protocol: 2 sec depolarizing prepulses (−110 to 30 mV) followed by a test pulse to −10 mV with a 10 sec time interval between measurements. Peak current density during the test pulse was used to plot inactivation curves (I/Imax vs prepulse voltage; data were fit with a single Boltzmann function). The half-inactivation voltages of the inactivation curves were −46.2 mV (slope factor, 18.8) for the wild-type cell (A1), −52.3 mV (slope factor, 18.4) for the tgla/+ cell (A2), and −50.7 mV (slope factor, 19.1) for thetgla/tglacell (A3). B1–B3, Barium currents elicited by a long 2 sec depolarizing voltage step to −10 mV. Percent inactivation was 69% in the wild-type cell (B1), 55% in the tgla/+ cell (B2), and 46% in thetgla/tglacell (B3). The same cells were used in Aand B.

