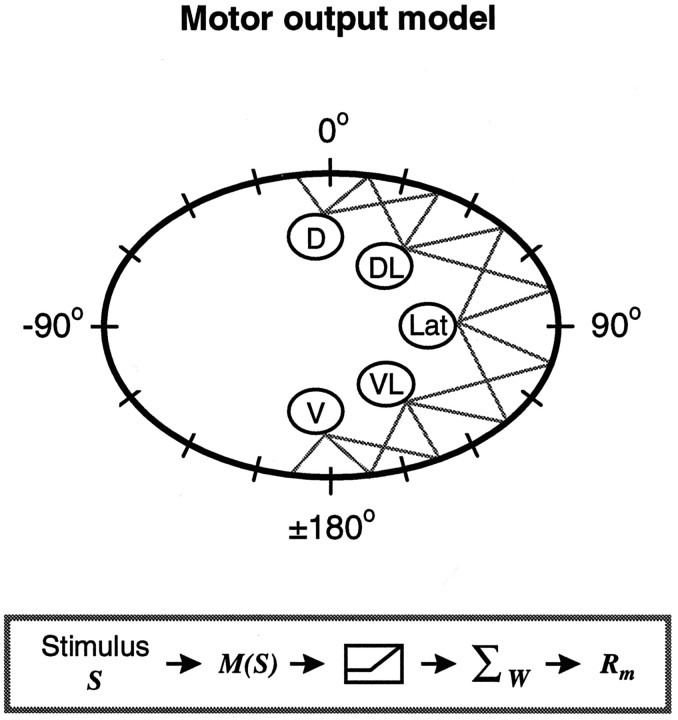
Fig. 8.
Motor output model. Given is a schematic illustration of the model used to predict motor neuron tuning. The body perimeter is shown in conventional coordinates; the 16 bins are shown by the dashes. The motor neurons innervating the right body wall are shown, with the gray lines indicating connections to a particular bin (innervation matrix). In thebox, a schematic flow of the model is provided. A stimulus at a location S results in activation of the different motor neurons, given by M(S). This motor neuron activity is passed through a threshold function. The model response Rm in a particular bin is determined by the summed activity of all the motor neurons innervating that bin (given by the innervation matrix,W).

