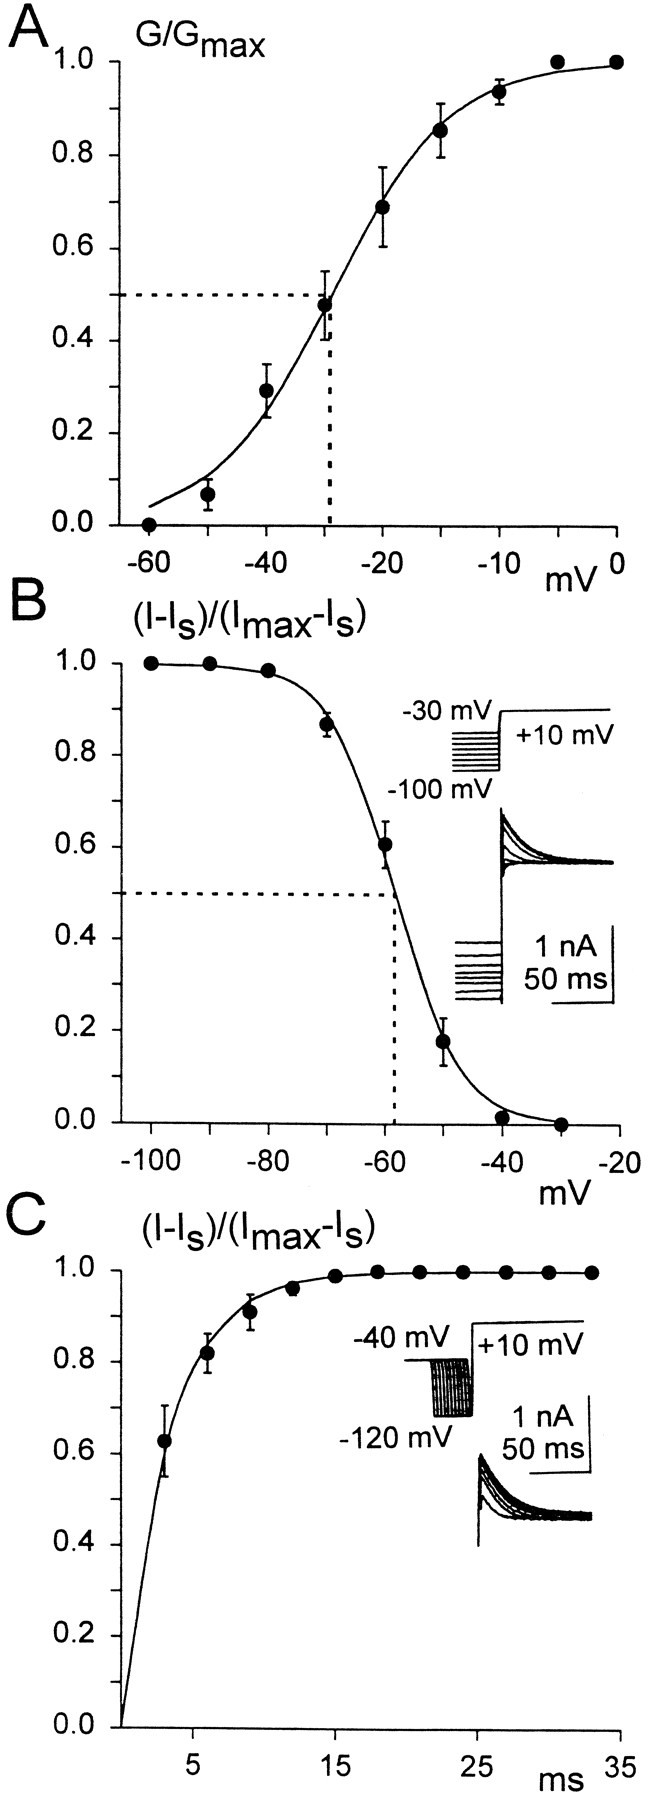
Fig. 4.

A, Steady-state activation of the transient current from an accommodating principal cell, plotted as a function of the membrane potential. Averaged, normalized conductance values were fit with the Boltzmann equation. Conductance (G) values were calculated by dividing the measured peak transient current by the driving force (V − Ek). Thedotted line indicates V1/2 = −29 ± 3 mV. B, Steady-state inactivation of the transient current. Averaged, normalized conductance values were fit with the Boltzmann equation. Normalized conductance values for the transient current were obtained by measuring the peak amplitude of the total current (I), subtracting the sustained current amplitude (Is), and then dividing by the total current maximum amplitude (Imax) minus the sustained current (Is). The dotted lineindicates V1/2 = −58 ± 1.2 mV.Inset, Current traces (bottom traces) elicited by voltage steps to + 10 mV, which were preceded by 200 msec voltage presteps from −30 to −100 mV, with 10 mV increments (top traces). C, Plot of averaged, normalized peak transient current versus the duration of the hyperpolarizing prepulse, fit with an exponential function.Inset, Transient current traces (bottom traces) elicited by stepping the membrane potential to +10, preceded by different duration hyperpolarizing presteps to −120 mV, which were preceded by a 200 msec prepotential to −40 mV. The normalized transient current value was calculated from the total peak current (I) by subtracting the sustained current (Is) and dividing by the total current maximum value (Imax) minus the sustained current (Is).
