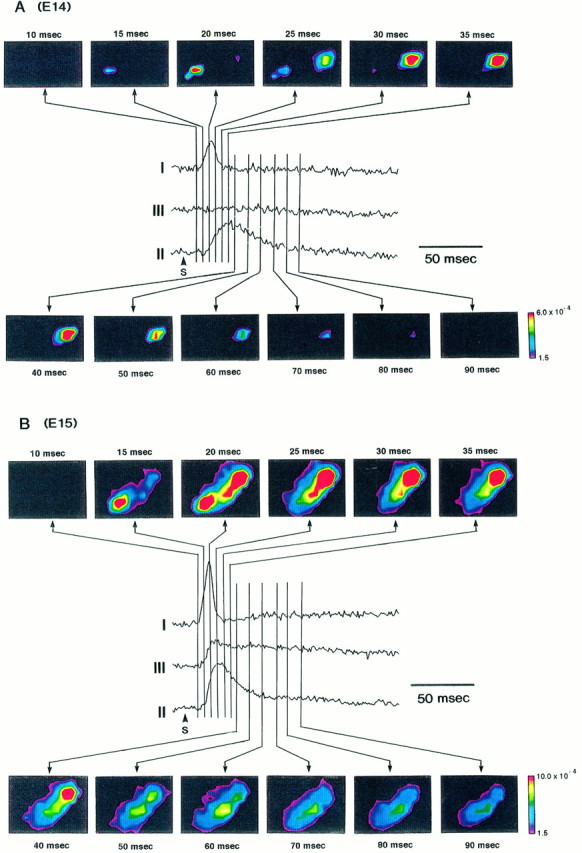
Fig. 15.

Spatiotemporal activity mappings. The time lapse imaging representations of the neural response in E14 (A) and E15 (B) preparations are shown. The images are compared with the signals obtained from three sites of the preparations. I andII were recorded from areas I and II, respectively.III was recorded from the midarea between areas I and II. Color imagings were constructed from the optical recording signals using an interpolation method of Transform (Fortner Research LLC, Sterling, VA).
