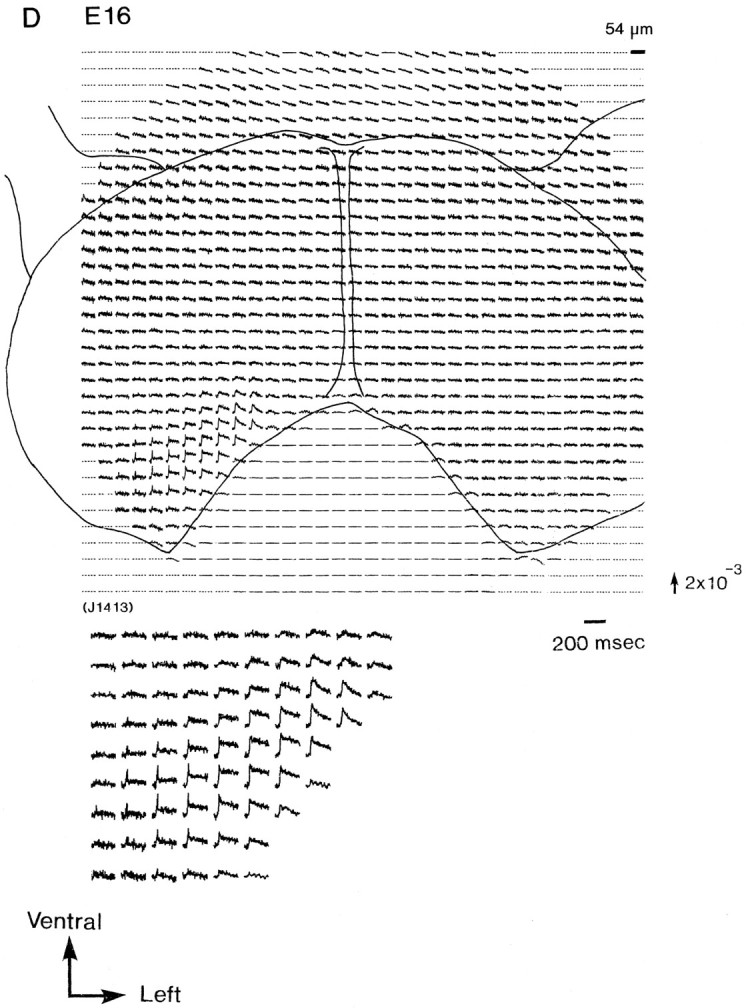
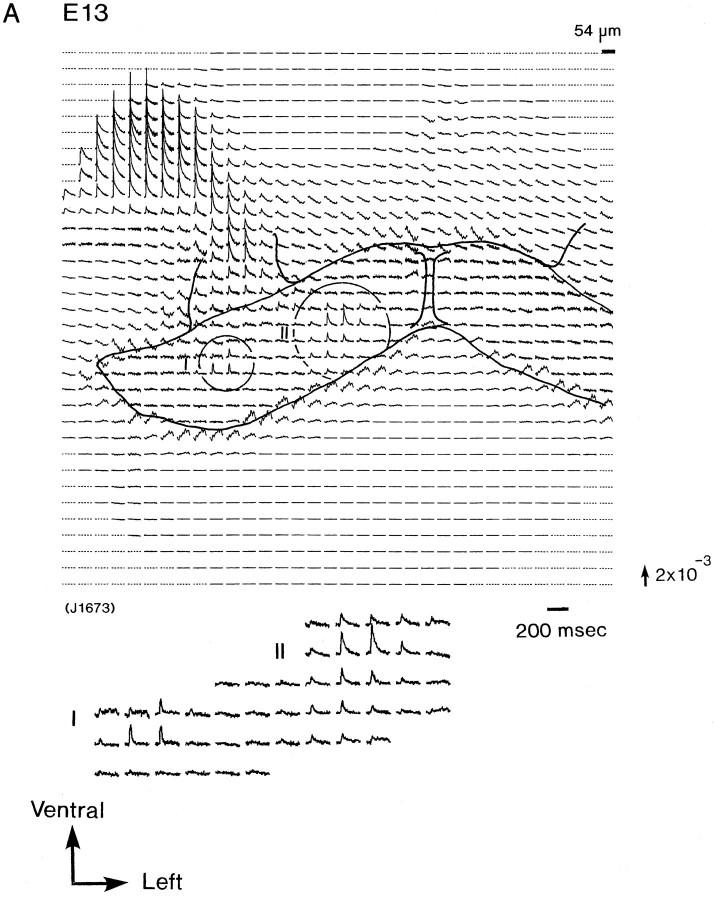
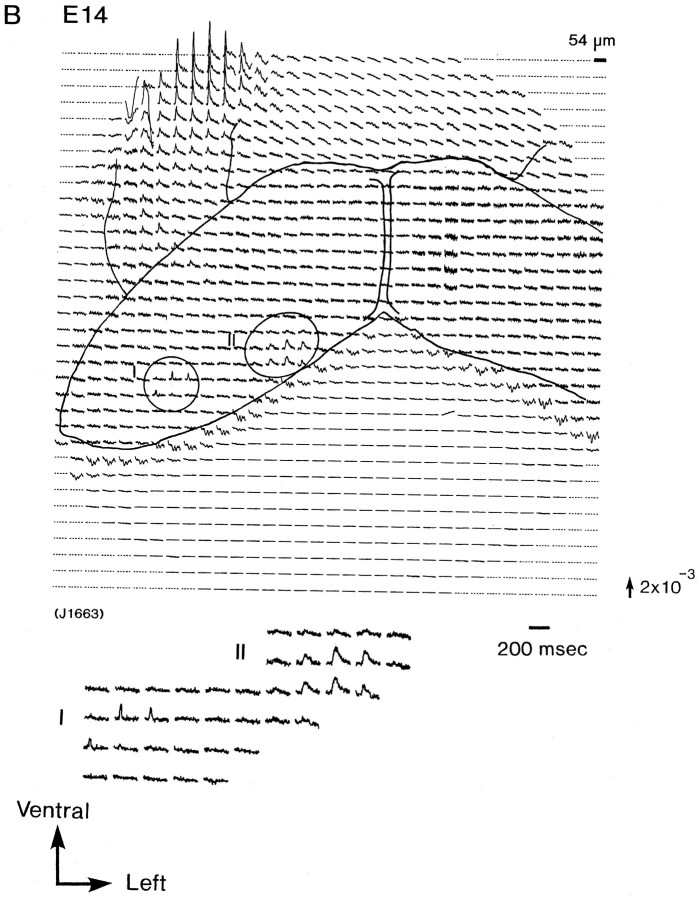
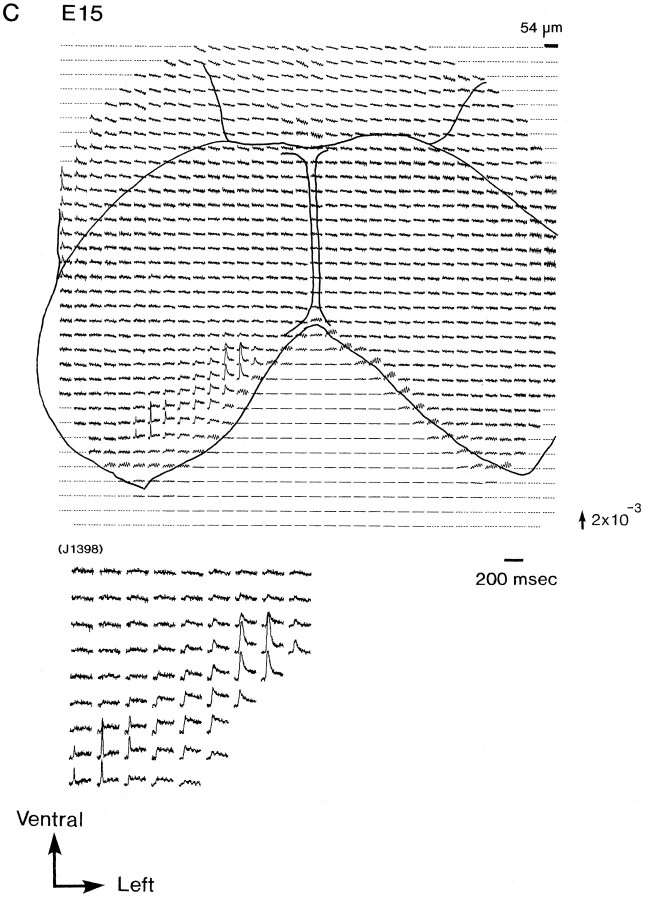
Fig. 2.

Simultaneous multisite optical recordings of neural responses. The optical signals were evoked by vagal stimulation, and they were recorded from E13 (A), E14 (B), E15 (C), and E16 (D) slice preparations, using the 1020-element photodiode array. The insets at thebottom left of each recording show the enlarged traces of the evoked optical signals. These signals were obtained in a single sweep. The direction of the arrow to theright of the recordings indicates a decrease in transmitted light intensity (increase in absorption), and the length of the arrow represents the stated value of the fractional change (the change in the light intensity divided by DC background intensity).


