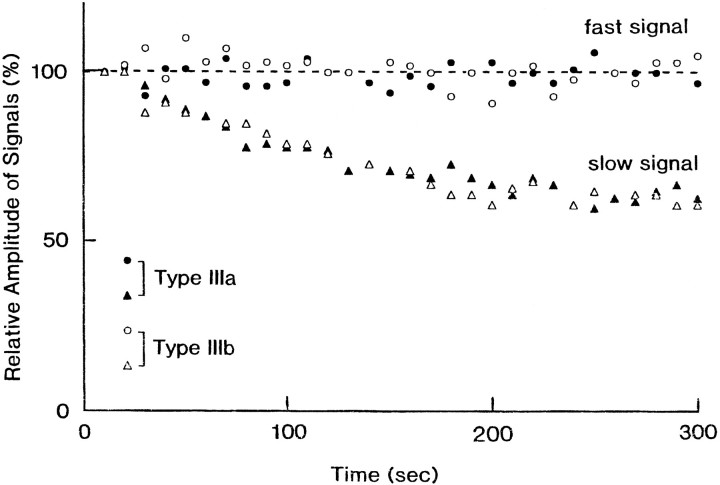
Fig. 4.
The decrease in the slow optical signal amplitude with repetitive stimulation. The measurements were made on an E16 preparation. Square current pulses of 8 μA/5.0 msec and 0.1 Hz were applied to the right vagus nerve. The relative amplitudes of the fast and slow signals in type IIIa and type IIIb are plotted against time in seconds. Closed circles, Fast signals in type IIIa;closed triangles, slow signals in type IIIa; open circles, fast signals in type IIIb; open triangles, slow signals in type IIIb.

