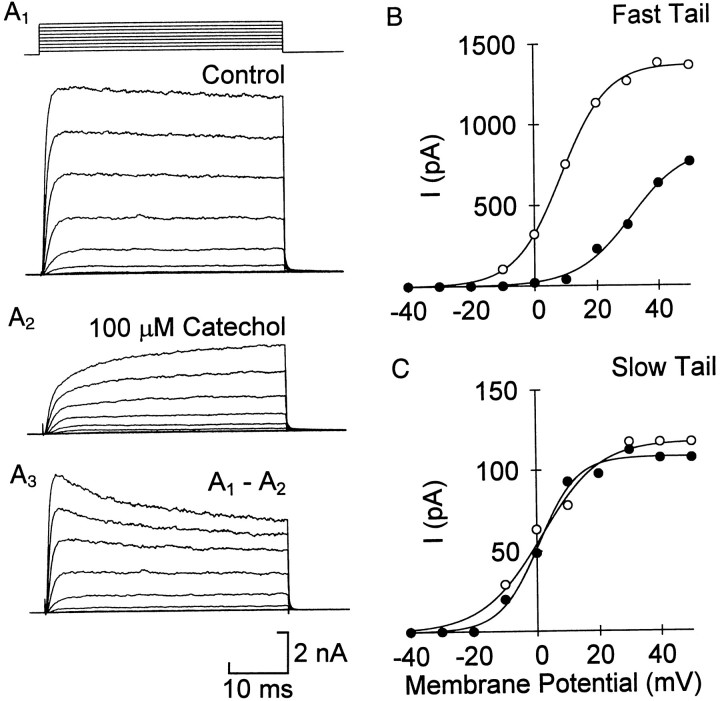
Fig. 3.
Voltage dependence of catechol- resistant and -sensitive current. Example of total current in control (A1) and 100 μm catechol (A2). A3, Difference currents, obtained by subtracting traces in A2from the corresponding ones in A1, show a decay in the catechol-sensitive current at positive voltages. Test voltages ranged from −40 to 40 mV in intervals of 10 mV. B, C, The catechol block of the fast currents partially reverses at positive voltages. The activation of the fast and slow currents was measured from the tail currents of a representative cell. B, In 100 μm catechol (filled circles) the activation of the fast current was shifted positive compared with control (open circles), whereas the shift of the slow current was small (C). The solid lines are the best fit of the equation: I= Imax/(1 + exp[(V − V½)/slope]) to the data. For the fast current the values for V½ and slope were 8.9 and −7.6 in control and 30.9 and −8.7 in catechol. The corresponding values for the slow current were 1.9 and −8.2 (control) and 0.6 and −6.8 (catechol).

