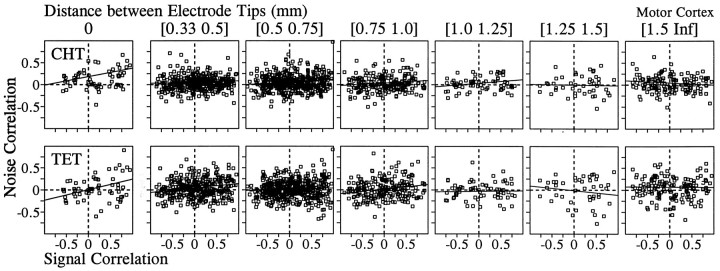
Fig. 5.
Relationship between the signal correlation and the noise correlation in the motor cortex during the CHT (top) and the TET (bottom). Pairs of neurons were divided into seven groups according to the distance between the electrode tips from which they were recorded. Thesolid line in each panel was determined by a linear regression. The correlation coefficients for these data are shown in Figure 7.

