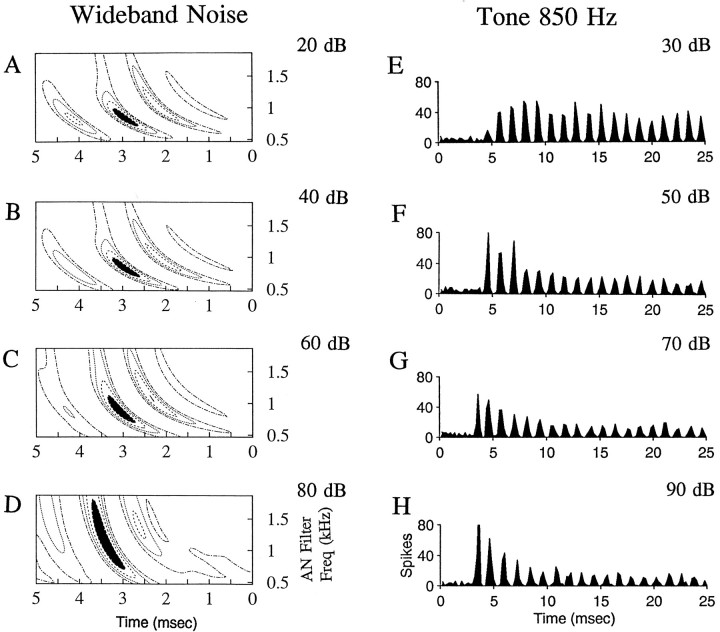
Fig. 6.
A–D, Spatiotemporal tuning patterns versus SPL for a primary-like cell with CF of ∼800 Hz. Note that the bandwidth of the peak region (filled area, top 25% of the pattern) increases with SPL.E–G, PST histograms in response to tones at CF of 850 Hz. Noise levels are indicated in decibels re: SPL rms; tone levels are in decibels re: SPL. Cell is g154U1.

