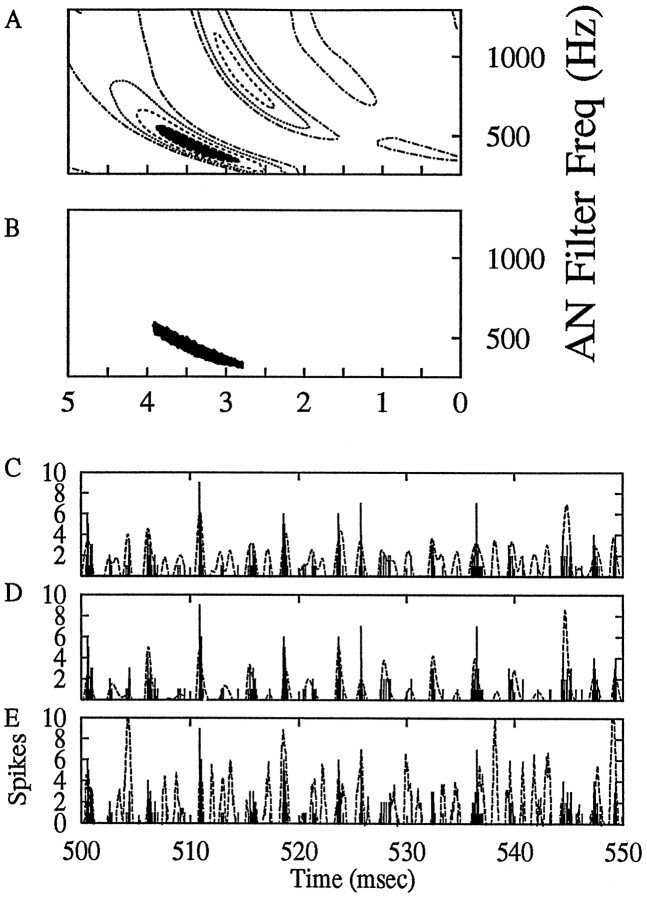
Fig. 8.
Prediction of the response of a cell to wide-band noise based on spatiotemporal tuning patterns. The noise was presented at 70 dB SPL rms. A, The full spatiotemporal tuning pattern. B, A simplified spatiotemporal tuning pattern that represents the peak 25% of the full pattern. C–E,Solid bars, The PST histogram for 50 msec of the response of this cell to a noise waveform that is independent from that used to find the spatiotemporal tuning pattern. C, The prediction (dotted line) of the response to this noise computed with the full spatiotemporal tuning pattern. D, The prediction (dotted line) based on the simplified spatiotemporal tuning pattern. E, The prediction (dotted line) of the PST based on a linear reverse-correlation analysis. Predictions were made for a noise waveform of 400 msec duration; the predicted responses were each normalized to the peak of the actual PST histogram. All predictions and the PST histogram have a temporal resolution (bin size) of 50 μsec, which is the time step used for the computations in the AN simulations. Mean squared errors between each prediction and the actual PST histogram are 1.95 (C), 1.07 (D), and 4.40 (E). Cell is g154u4.

