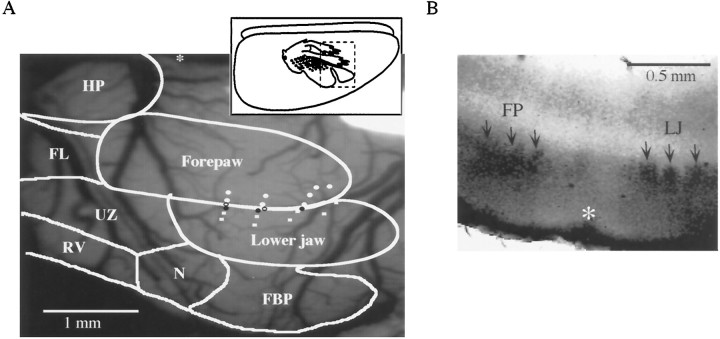
Fig. 1.
A, Example of mapping the forepaw–lower jaw border. Inset shows a schematic of a lateral view of the rat cortex, indicating the approximate location of the “ratunculus”; dashed box indicates the approximate location of the craniotomy and the body surface map illustrated in the main figure. An outline of the rat S1 map is superimposed over the surface of the cortex (Chapin and Lin, 1984).White circles represent penetrations responding to forepaw stimulation, white squares represent lower jaw responsive penetrations, and open circles reflect penetrations responding to both. Black circles represent the dye marks that defined the border between representations. Theasterisk is placed at bregma, rostral is to theright, lateral is toward the bottom.FBP, Frontal buccal pads; N, nose;RV, rostral vibrissae; UZ, unresponsive zone; FL, forelimb; HP, hindpaw.B, Cytochrome oxidase staining from a marked slice (100 μm thick). The location of the mark is indicated by theasterisk, and the arrows point to individual barrels in layer 4 in the forepaw (FP) and lower jaw (LJ) representations. Medial is to theleft and the surface of the cortex is at thebottom.

