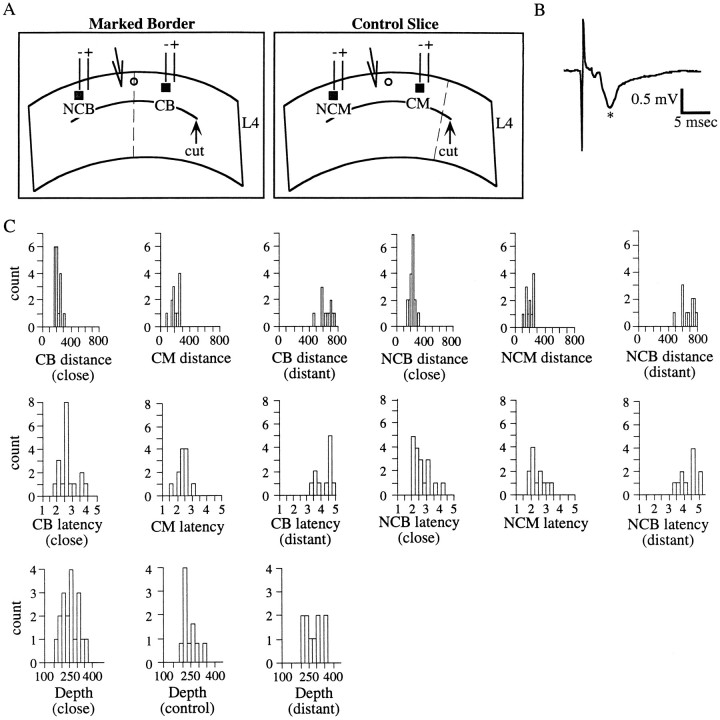
Fig. 2.
The slice preparation: stimulating and recording parameters. A, Schematic representations of coronal slices taken from rat S1 used in these studies. In both schematics, theinverted triangle represents the recording electrode, the heavy line represents the cut placed in layer 4 to isolate supragranular layers, and the dotted linerepresents the location of the border between the forepaw and lower jaw representations. The parallel lines represent the stimulating electrodes, with the polarities of the two electrodes indicated. Note that the same polarity configuration was used between CB and NCB stimulation, so that the same electrode of the bipolar pair was at the stimulation site. Left panel, Schematic of a slice in which the border between the forepaw and lower jaw was marked before slicing. Black square, Cross-border (CB) simulation site; gray square, noncross-border (NCB) stimulation site; open circle, dye mark, dotted line, border. Right panel, Schematic of a control slice in which the dye mark (open circle) was placed at a site in the forepaw representation of S1 away from the border (dotted line). Black square, Cross-mark (CM) stimulation site (note that no border is interposed between stimulating and recording);gray square, noncross mark (NCM) stimulation site. B, Example of a maximal amplitude field potential recorded from a slice in which the forepaw–lower jaw border was marked in vivo. The potential was recorded in cortical layer 3 in response to electrical stimulation (90 μA) above cortical layer 4. This trace is the average of 20 individual potentials. The asterisk marks the main negativity (see Materials and Methods). C, Frequency distributions of estimated stimulation distances from neurons, latencies from stimulus to PSP onset, and estimated distances of neurons from the cortical surface (i.e., depth), for close stimulation, control slices, and distant stimulation. For distances and latencies, data from both cross and noncross stimulating cases are shown. These distributions clearly demonstrate that these data are generally poorly fit by a normal distribution, and thus nonparametric statistical tests were used to compare them.

