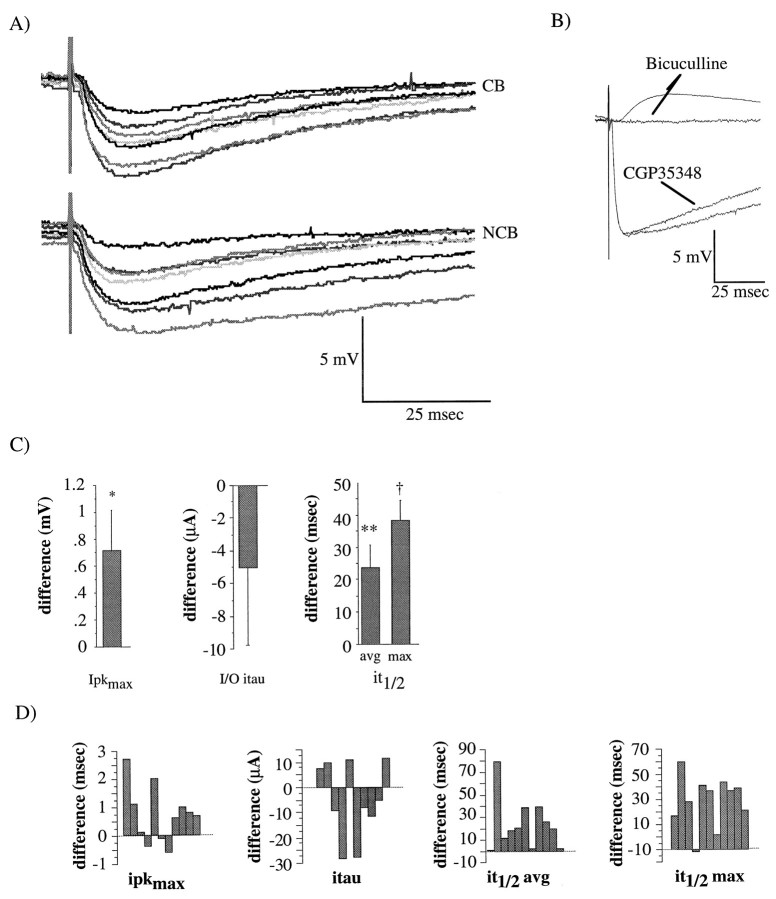
Fig. 6.
Examples of monosynaptic IPSPs and quantification of differences between NCB and CB stimulation. A, Examples of direct IPSPs recorded in the presence of 12 μm DNQX and 100 μm APV; the membrane potential was adjusted to −45 mV. These IPSPs were recorded from the same neuron as were the PSPs shown in Figure 2. Correspondingshades of gray represent responses from corresponding stimulus intensities as in Figure 3. Top traces, averages of 3–5 IPSPs evoked from minimal to maximal stimulus intensities, CB stimulation. Bottom traces, IPSPs evoked with NCB stimulation in the same cell. B, Effects of 50 μm CGP35348 (second from bottom trace) and bicuculline (top traces) on IPSPs. Note the residual EPSP in the presence of bicuculline in some cases. Each trace is the average of three potentials, and the membrane potential was adjusted to −45 mV. C, Mean differences (NCB − CB) in ipkmax (left), I–O iτ (center), it1/2 avg and it1/2max (right). Significance values are from paired, Student’s t tests performed on each of the parameters from NCB stimulation versus those from CB stimulation,n = 11 neurons. *p < 0.05; **p < 0.01. D, Individual difference scores from each neuron used to calculate the means inB.

