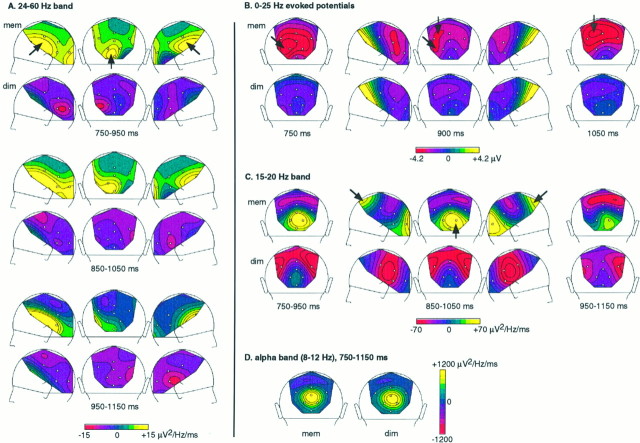
Fig. 5.
Summary of the activities observed during the delay. A, γ-band (24–60 Hz) energy in the memory (top row) and in the dimming condition (bottom row), averaged on three overlapping 200-msec time windows (750–950, 850–1050, and 950–1150 msec). Topographical maps of left, back, and right views of the head are displayed for these three time windows. Enhanced γ-band activity appears in the memory condition at left posterior electrodes, and bilaterally at more frontal sites (arrows). Differences between conditions are more significant at the beginning of the delay (750–950 and 850–1050 msec time windows) than in the end (950–1150 msec). B, Topographical maps of the evoked potential in both conditions, at three latencies (700, 900, and 1050 msec). Two negativities with different time courses and topographies can be observed in the memory condition (arrows): a left posterior negativity is prominent at the beginning of the delay and decreases in the end of the delay, whereas a parietocentral negativity rises. C, Energy (15–20 Hz) averaged in three 200 msec time windows in both conditions. An occipital enhancement, with a tendency for being lateralized on the right, is observed in the memory condition. Another peak of 15–20 Hz activity is observed in the memory condition at the midline frontal electrode. D, Energy in the α-band (8–12 Hz), averaged between 750 and 1150 msec. No difference between the two conditions could be detected in this frequency band during the delay.

