
Fig. 6.
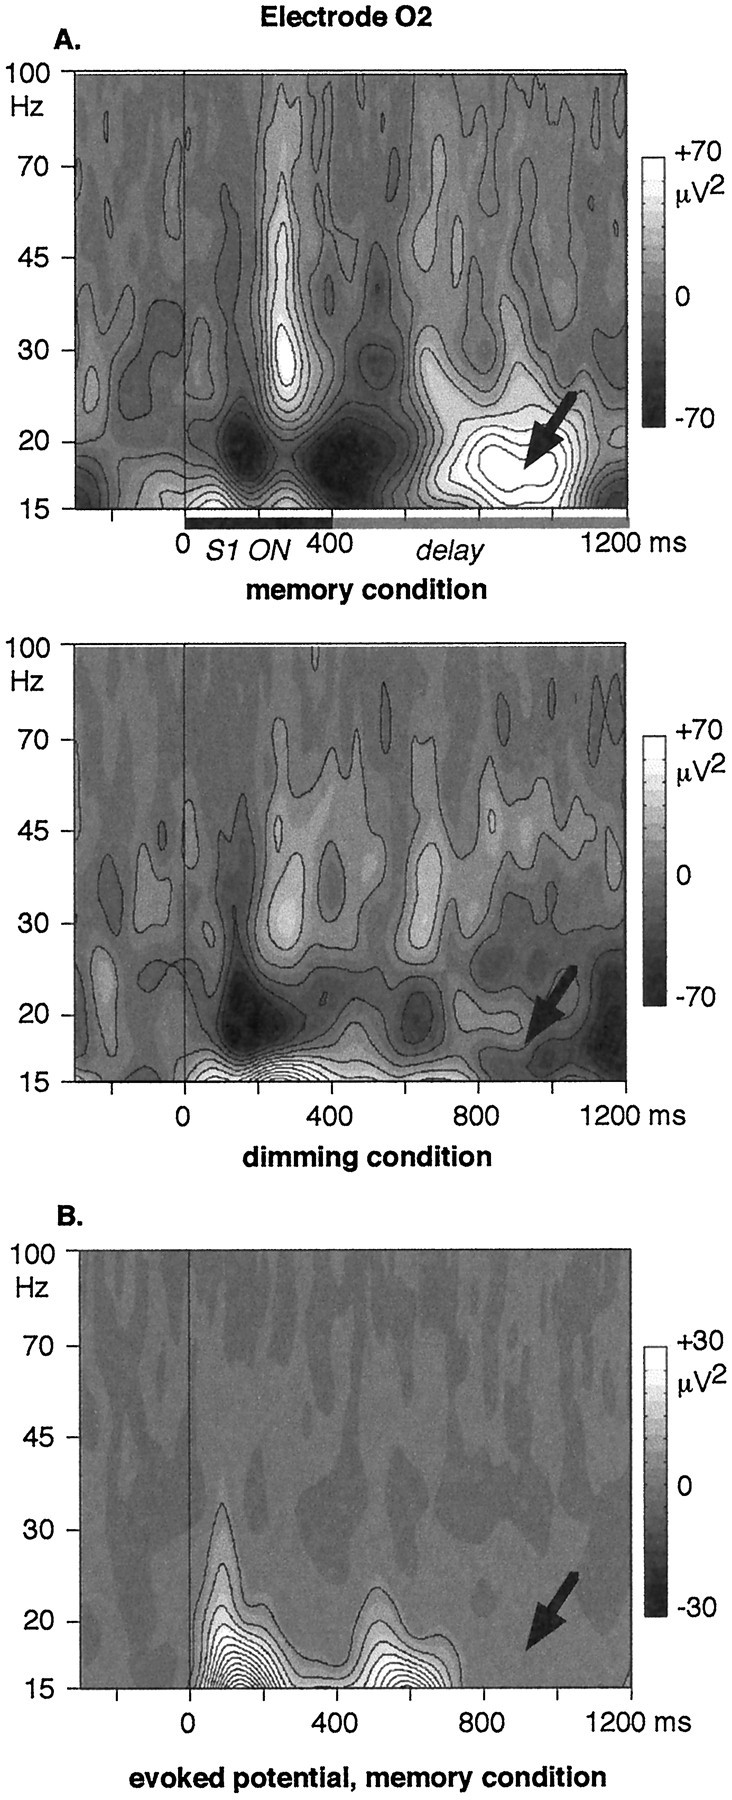
A, Time–frequency energy averaged across single trials at electrode O2, in the memory (top) and in the dimming (bottom) conditions. Sustained 15–20 Hz activity is observed during the delay in the memory condition only (arrows). B, Time–frequency energy of the averaged evoked potential at electrode O2, in the memory condition. The 15–20 Hz energy observed during the delay disappears: it is an induced activity.