

Abstract
The modulation of motor behavior by protein kinase C (PKC) signaling pathways in nigrostriatal neurons was examined by using a genetic intervention approach. Herpes simplex virus type 1 (HSV-1) vectors that encode a catalytic domain of rat PKCβII (PkcΔ) were developed. PkcΔ exhibited a constitutively active protein kinase activity with a substrate specificity similar to that of rat brain PKC. As demonstrated in cultured sympathetic neurons, PkcΔ caused a long-lasting, activation-dependent increase in neurotransmitter release. In the rat brain, microinjection of HSV-1 vectors that contain the tyrosine hydroxylase promoter targeted expression to dopaminergic nigrostriatal neurons. Expression of pkcΔ in a small percentage of nigrostriatal neurons (∼0.1–2%) was sufficient to produce a long-term (≥1 month) change in apomorphine-induced rotational behavior. Nigrostriatal neurons were the only catecholaminergic neurons that contained PkcΔ, and the amount of rotational behavior was correlated with the number of affected nigrostriatal neurons. The change in apomorphine-induced rotational behavior was blocked by a dopamine receptor antagonist (fluphenazine). D2-like dopamine receptor density was increased in those regions of the striatum innervated by the affected nigrostriatal neurons. Therefore, this strategy enabled the demonstration that a PKC pathway or PKC pathways in nigrostriatal neurons modulate apomorphine-induced rotational behavior, and altered dopaminergic transmission from nigrostriatal neurons appears to be the affected neuronal physiology responsible for the change in rotational behavior.
Keywords: genetic intervention, herpes simplex virus type 1 vectors, protein kinase C, nigrostriatal neurons, motor behavior, basal ganglia
The alterations in synaptic transmission that cause behavioral adaptations are thought to be mediated by changes in specific biochemical pathways in particular types of neurons (Hebb, 1949), but the complexity of brain anatomy and physiology has complicated experimental demonstrations. In invertebrates, signal transduction pathways mediate behavioral adaptations, including the gill withdrawal reflex in Aplysiaand long-term associative learning in Drosophila (Dudai, 1989). In contrast, in mammals, these pathways mediate short-term changes in neuronal physiology (Kazmarek and Levitan, 1987), but relatively little is known about the capability of a specific signal transduction pathway, acting in a particular type of neuron, to direct a change in behavior.
The protein kinase C (PKC) pathway is a promising candidate for mediating changes in synaptic transmission that direct changes in behavior (Tanaka and Nishizuka, 1994). PKC substrates play critical roles in neuronal physiology, and activation of PKC, usually by phorbol esters, can increase the release of various classical neurotransmitters from diverse neuronal systems (Pozzan et al., 1984; Nichols et al., 1987; Coffey et al., 1993). Nonetheless, evidence for the involvement of PKC in specific behaviors remains indirect: PKC may be activated in specific neurons in response to pain (Mao et al., 1992) or during lordosis (Kow et al., 1994). During long-term potentiation (LTP), hippocampal neurons contain a constitutively active catalytic domain of PKCζ (Sacktor et al., 1993) that resembles the catalytic domains of PKC produced by calpain (Kishimoto et al., 1989). PKCγ knock-out mice display defective regulation of LTP (Abeliovich et al., 1993a) and mild deficits in selected learning paradigms (Abeliovich et al., 1993b). However, concomitant defects in cerebellar development and motor coordination (Chen et al., 1995; Kano et al., 1995), as well as the absence of PKCγ from every cell in the mouse, complicate the interpretation of these experiments.
The nigrostriatal dopamine (DA) system is one of the few systems in which a significant body of evidence suggests that the function of a specific type of neuron regulates a specific set of behaviors: degeneration of substantia nigra pars compacta (SNc) neurons underlies Parkinson’s disease; ablation (Ungerstedt, 1971) or electrical stimulation (Arbuthnott and Ungerstedt, 1975) of SNc neurons can alter rat motor behavior; SNc neuron activity (Diana et al., 1989) and striatal DA release (Yamamoto et al., 1982) are increased in rats trained to circle; and rats, cats, and humans exhibit a low level of spontaneous rotational behavior, probably because of hemispheric imbalances in the nigrostriatal system (Jerussi and Glick, 1976; Glick et al., 1981; Gospe et al., 1990).
The capability of the PKC pathway in SNc neurons to modulate rotational behavior was examined via a three-part genetic intervention strategy (Geller et al., 1991): (1) microinjection of a Herpes simplex virus type 1 (HSV-1) vector restricts gene transfer to a specific brain area (During et al., 1994); (2) a cell type-specific promoter, such as a preproenkephalin promoter (Kaplitt et al., 1994) or a tyrosine hydroxylase (TH) promoter (Song et al., 1997), targets expression to a specific type of neuron; and (3) a constitutively active signal transduction enzyme, such as an adenylate cyclase, causes long-lasting activation of a specific signaling pathway, thereby altering neuronal physiology, such as increasing neurotransmitter release (Geller et al., 1993). We used this genetic intervention strategy to introduce a constitutively active fragment of rat PKCβII (PkcΔ, encoded by pkcΔ) into SNc neurons. In cultured neurons, PkcΔ caused a long-lasting, activation-dependent increase in neurotransmitter release. In the brain, microinjection of HSV-1 vectors that contain the TH promoter targeted expression to SNc neurons. Expression of pkcΔ in a small percentage of the SNc neurons resulted in a long-term change in apomorphine-induced rotational behavior. The magnitude of the change was correlated with the number of affected SNc neurons, and D2 DA receptor density was increased in the regions of the striatum innervated by these neurons. Thus, this modulation of apomorphine-induced rotational behavior was produced by alterations in dopaminergic neurotransmission, arising from activation of the PKC pathway in SNc neurons.
MATERIALS AND METHODS
Vectors. pHSVlac (Geller and Breakefield, 1988) and pTHlac (Song et al., 1997) have been described. pTHlac contains a 6.8 kb fragment of the rat TH promoter (Brown et al., 1987). Constructions were performed by standard recombinant DNA procedures (Maniatis et al., 1982). PKCβII (PKC-II; Knopf et al., 1986) was partially digested with an enzyme that yields a blunt end [nucleotides 719, 749, 831, 871, and 994 (pkcΔ)], and the appropriate ClaI linker was ligated (5′-CATCGATG-3′ or 5′-CCATCGATGG-3′ or 5′-CCCATCGATGGG-3′; New England Biolabs, Beverly, MA) for fusion to the 3′ end of flag (Prickett et al., 1989) in pHSVflag (Geller et al., 1993); the 3′ end was an EcoRI site 3′ to the cDNA. In pkcΔ, 3′ untranslated sequences were deleted to nucleotide 2166, just beyond the termination codon (nucleotides 2160–2162). The sequence surrounding the ATG (5′-TAAGCTTACCATGG-3′) contains a Kozak consensus translation start sequence and both HindIII and NcoI sites that were used in subsequent constructions (see below). So that an in situ hybridization probe could distinguish pkcΔ transcription unit RNA from endogenous rat PKCβ mRNAs, all of the pkcΔ vectors used in this study (for expression in mammalian cells) contain a 314 bp fragment from the 3′ end of the lacZ gene, and this fragment is located in the 3′ untranslated region of the vectors just before the SV40 early region polyadenylation site (Geller and Breakefield, 1988;Geller et al., 1993).
We isolated two point mutations in pkcΔ to enable experimental demonstrations that the effects of PkcΔ on neuronal physiology are attributable to PKC enzyme activity. An absolutely conserved Lys residue, present in subdomain II of all members of the protein kinase family, is required for efficient phosphoryl transfer (Hanks et al., 1988). Mutation of this Lys residue is a standard method for inactivating protein kinases (for review, see Hanks et al., 1988), including PKC (Ohno et al., 1990), and the corresponding Lys codon in pkcΔ was replaced with either a Gly or an Arg codon. Two fragments that contain the mutation (generates a BamHI site) and extend 5′ or 3′ were produced by PCR [template, pHSVpkcΔ; primers, 5′ fragment, 5′-CTACAAAGACGATGACGATAAATCG-3′ (from flag;Prickett et al., 1989) and 5′-CCACATCTTTCTTCAGGATCC(C, Gly; G, Arg)CACGGC-3′ (complementary to PKCβII nucleotides 1245–1272 [Knopf et al., 1986] except for the mutation); 3′ fragment, 5′-GCCGTG(G, Gly; C, Arg)GGATCCTGAAGAAAGATGTGG-3′ (PKCβII nucleotides 1245–1272 except for the mutation); and 5′-GATCTACTTAGCTCTTGACTTCGGG-3′ (complementary to PKCβII nucleotides 2145–2169)]. After digestion (5′ fragment,KpnI and BamHI; 3′ fragment, BamHI andBstBI), fragments were inserted into pHSVpkcΔ (KpnI and BstBI) to yield pHSVpkcΔGG and pHSVpkcΔAA.
YEp51pkcΔ, YEp51pkcΔAA, and YEp51pkcΔGG were constructed with the YEp51 vector, previously used to express mammalian PKC genes inSaccharomyces cerevisiae (Riedel et al., 1993). YEp51 was digested with HindIII and BamHI; each of the three pHSVpkc vectors (pHSVpkcΔ, pHSVpkcΔAA, and pHSVpkcΔGG) was digested partially with HindIII and to completion withBglII; and the fragments that contain pkcΔ, pkcΔAA, or pkcΔGG were inserted into YEp51.
pTHpkcΔ and pTHpkcΔGG were designed to express an mRNA essentially identical to that expressed by pHSVpkcΔ except for the addition of a short sequence (<30 nucleotides) immediately after the transcription start site of the TH promoter. The lacZgene in pTHlac (Song et al., 1997) was replaced with the intron following the HSV immediate early (IE) 4/5 promoter [isolated by PCR: template, pHSVpkcΔ (Geller et al., 1993); primers, 5′-GGG AAGCTTACGGCGCCGGCCACGAACGACGGG-3′ and 5′-G CCATGGTGCTTATCGACGAGGACGTTCTTCC-3′; PCR products were digested with HindIII and NcoI] and either pkcΔ or pkcΔGG (NcoI and BglII)]. To verify gene expression from these vectors, we infected catecholaminergic cell lines; 1 d later both pkcΔ transcription unit RNAs and flag-IR positive cells were detected.
Packaging vectors into HSV-1 particles. CV1 monkey fibroblasts were maintained in DMEM supplemented with 10% fetal bovine serum (FBS). M64A cells were maintained in DMEM supplemented with 5% FBS and hypoxanthine aminopterin thymidine (HAT) medium, and E5 cells were maintained in DMEM supplemented with 10% FBS and 0.5 mg/ml G418. Initial candidate vectors and vectors for DA release experiments were packaged (Geller et al., 1990) with HSV-1 strain 17 D30EBA (partial deletion of IE 3; Patterson and Everett, 1990) and M64A cells (Davidson and Stow, 1985). For all other experiments, including3H-norepinephrine (NE) release and all in vivoexperiments, KOS strain d120 (complete deletion of IE 3) and E5 cells (DeLuca et al., 1985) were used for packaging (Lim et al., 1996). The titers [Geller et al. (1993); Song et al. (1997) and immunocytochemistry section] of these vector stocks [which did not contain detectable levels of wild-type HSV-1 (<10 pfu/ml)] were 2.0 × 10⁶ infectious vector particles (IVP)/ml pTHpkcΔ and 2.6 × 10⁷ plaque forming units (pfu)/ml d120; 2.6 × 10⁶ IVP/ml pTHpkcΔGG and 1.4 × 10⁷ pfu/ml d120; 1.4 × 10⁷ IVP/ml pHSVpkcΔ and 4.1 × 10⁷ pfu/ml d120; 1.4 × 10⁶IVP/ml pTHlac and 1.6 × 10⁷ pfu/ml d120; and 2.5 × 10⁷ IVP/ml pHSVlac and 6.1 × 10⁷ pfu/ml d120.
Neural cell culture and gene transfer. PC12 cells (Greene and Tischler, 1976) were maintained in DMEM supplemented with 5% FBS and 10% horse serum. Cultures of dissociated superior cervical ganglia (Hawrot and Patterson, 1979) were prepared from 4-d-old Sprague Dawley rats. [All work with rats was approved by Children’s Hospital Institutional Animal Care and Use Committee (IACUC).] Cultures were treated with cytosine arabinoside (40 μm) on days 5–6 and used for expression studies within 2 weeks thereafter. PC12 cells (5 × 10⁵ cells/0.5 ml) or sympathetic cells (∼2 × 10⁵ cells/0.5 ml) were infected with vector stocks (∼0.1 multiplicity of infection). Assays were performed or cell extracts were prepared at 1 d after infection.
Antibodies. Polyclonal rabbit anti-flag antibody was raised against NH2-MDYKDDDDKSC-NH2 coupled to bovine serum albumin and affinity-purified by chromatography on SulfoLink resin (Pierce, Rockford, IL) to which the peptide was coupled. Mouse monoclonal anti-flag antibody (M-5) was kindly provided by Dr. M. Leahy (Immunex, Seattle, WA). Affinity-purified rabbit anti-rat PKCβII antibody was obtained from Santa Cruz Biotechnology (Santa Cruz, CA). Swine anti-rabbit immunoglobulin (Ig) G antibody and rabbit anti-HSV-1 particle antibody were obtained from Dako (Carpinteria, CA). Alkaline phosphatase-conjugated goat anti-mouse IgG antibody, alkaline phosphatase-conjugated goat anti-rabbit IgG antibody, mouse monoclonal anti-TH antibody, and alkaline phosphatase-conjugated rabbit anti-digoxigenin antibody were purchased from Boehringer Mannheim (Indianapolis, IN). Biotinylated goat anti-mouse IgG antibody and biotinylated goat anti-rabbit IgG antibody were obtained from Jackson ImmunoResearch Laboratories (West Grove, PA).
Immunocytochemistry. The cells were fixed with 4% paraformaldehyde in PBS, pH 7.4, rinsed with PBS (three times for 5 min each), and immunocytochemistry was performed. The cells were incubated (overnight at 4°C) in PBS, 2% normal goat serum, 0.2% Triton X-100, and either mouse monoclonal anti-flag antibody (1:5000 dilution) or rabbit anti-flag antibody (0.06 μg/ml). The cells were rinsed with PBS, 0.2% Triton X-100 (three times for 10 min each), and then incubated (2 hr, room temperature) with either alkaline phosphatase-conjugated goat anti-mouse IgG antibody (1:2000 dilution) or alkaline phosphatase-conjugated goat anti-rabbit IgG antibody (1:2000 dilution) in PBS and 0.2% Triton X-100. The cells were rinsed with 50 mm Tris-HCl, pH 7.4 (three times for 10 min each), and alkaline phosphatase activity was visualized by the BCIP/nitroblue tetrazolium (NBT) substrate (Sigma, St. Louis MO) in the presence of levamisole (Sigma) to inhibit endogenous alkaline phosphatase activity. Flag-IR positive cells were counted under 20× magnification.
Expression of recombinant PKCs in yeast. YEp51pkcΔ, YEp51pkcΔAA, and YEp51pkcΔGG use the S. cerevisiae Gal 10 promoter to regulate expression of the recombinant PKCs, and these three plasmids were introduced into S. cerevisiae 334 (Hovland et al., 1989). S. cerevisiae transformants were grown to 0.5 optical density (600 nm) at 30°C in minimal medium lacking Leu and containing 2% d-glucose. Expression of recombinant PKCs was induced by the addition of 0.1 vol of 20%d-galactose. The cells were harvested by centrifugation after an additional 2 hr of incubation, which resulted in levels of recombinant PKC protein ranging from 0.2 to 1.0 ng/μg total cellular protein.
Western blots. S. cerevisiae extracts and PC12 cell extracts were prepared by sonication and heating in 5 mm Tris-HCl, pH 8.0, 2 mm EDTA, and 2% SDS. Soluble protein was collected after centrifugation for 10 min at 9000 × g. S. cerevisiae extracts, PC12 cell extracts, and purified rat brain PKC [kindly provided by Dr. M. D. Browning (University of Colorado, Denver)] were subjected to SDS-polyacrylamide gel electrophoresis and transferred electrophoretically to nitrocellulose (0.2 μm; Costar, Cambridge, MA). Protein transfer was recorded xerographically after Ponceau S staining, and the blots were quenched/destained with polyvinylpyrrolidone (Haycock, 1993). Then replicate blots were incubated sequentially with primary antibody (1 μg/ml of either rabbit anti-flag antibody or rabbit anti-rat PKCβII antibody for 1 hr), secondary antibody (0.5 μg/ml of swine anti-rabbit IgG antibody for 1 hr), and 125I-protein A (4 × 10⁵ cpm/ml for 1 hr; New England Nuclear, Boston, MA). Immunoreactivity was visualized by autoradiography.
PKC enzyme activity assays. Peptide substrates were synthesized by the Louisiana State University (New Orleans, LA) Core Labs, purified by reverse-phase HPLC with a C18 column (Vydac, Hesperia, CA), and analyzed by electrospray mass spectrometry. Pellets of S. cerevisiae were lysed by vortexing in an equal volume of lysis buffer (50 mm Tris-HCl, 1 mm EGTA, 1 mm benzamidine, 20 μm leupeptin, and 0.1% NP40, pH 8.0, at 0–4°C) and 2 vol of glass beads. Soluble protein was collected after centrifugation for 10 min at 9000 ×g. The disruption of the S. cerevisiae was repeated twice, and the supernatants were combined and filtered (1.0 μm glass microfiber). A constitutively active fragment of purified rat brain PKC was derived by partial digestion with trypsin (kindly provided by Dr. Browning).
Aliquots (5 μl) of the S. cerevisiae extracts or the proteolytically activated rat brain PKC (in extraction buffer) were incubated with peptide substrates in a reaction mixture containing the following (final concentrations in mm): 50 HEPES (pH 7.4, using Tris base), 10 magnesium acetate, 1 DTT, and 0.1 [γ-32P] ATP (500–1000 cpm/pmol; New England Nuclear) plus 5 μm leupeptin and 50 nm okadaic acid. Reactions (50 μl final volume) were initiated by the addition of the ATP, incubated for 10 min at 30°C, and terminated by spotting on Whatman P81 paper. Endogenous calcium-dependent kinase activity (e.g.,S. cerevisiae PKC) was inhibited by the EGTA present in the extraction buffer. The unincorporated 32P was removed by rinsing the P81 paper in phosphoric acid, and the amount of32P incorporation was determined by liquid scintillation spectrometry (Roskoski, 1983). Relative 32P incorporation values were calculated after subtracting the amount of 32P incorporated in the absence of added substrate.
Neurotransmitter release assays. Cultured sympathetic neurons from 2- to 4-d-old rats were used to study catecholamine release. The release of endogenous DA, which affords greater detection sensitivity as compared with NE, was analyzed according to Geller et al. (1993). One day after infection, the culture medium was replaced with 0.2 ml of release buffer. Release buffer consisted of (in mm) 135 NaCl, 3 KCl, 1 MgCl2, 1.2 CaCl2, 2 NaPO4, pH 7.4, and 10 glucose. “High K+” release buffer contained 56 mm KCl (replacing NaCl), and “Ca-free” release buffer contained 0.1 mm EGTA in place of the CaCl2. Release buffer was collected after a 15 min incubation at 37°C, and one-tenth volume each of 2 m HClO4 and 1% Na2S2O5 was added on ice. Catecholamines and metabolites (with dihydroxybenzoic acid added as internal standard) were separated by HPLC and analyzed with a serial array of 16 electrode sensors (ESA, Chelmsford, MA). Peaks were validated by comparison to standards (match criteria: retention time ± 2%; peak width ± 3 sec; peak ratio between sensors >80%). The amount of catecholamines in each sample was quantitated on the basis of peak height (dominant sensor) relative to standards. Efflux was calculated as pg DA/min per 106 cells, and basal efflux refers to efflux in release buffer, whereas K+-dependent release refers to the difference between basal efflux and efflux in high K+ release buffer.
The release of previously accumulated [3H]-NE from cultured sympathetic neurons was studied according to Wakade and Wakade (1988), using culture medium without serum supplement as the release buffer. One day after infection, cultures were rinsed and then incubated (1 hr at 37°C) in release buffer containing [3H]-NE (0.1 μm, 15.4 Ci/mmol; NET-377, New England Nuclear). After three 20 min rinses, cultures were brought to room temperature, and 0.3 ml of release buffer containing 2 μm desipramine was added and collected every 3 min. After four or five collections (at which point basal efflux had stabilized), release was induced by switching to release buffer containing an additional 30 mm KCl (with or without 1.2 mmEGTA). At the end of the incubations, cells were lysed in 0.5 ml of 0.5% SDS. Radioactivity in the incubations and cell lysates was determined by liquid scintillation spectroscopy, and efflux was calculated as the percentage of the total radioactivity per well. Basal efflux and K+-dependent release were calculated as above.
As used within the context of K+-stimulated efflux over a duration of 15 or 3 min, “release” is not intended to represent either the initial rates of secretion or those processes underlying the rapid kinetics of synaptic transmission.
Stereotactic injections and behavioral testing. Vector stocks were purified and concentrated as described (Lim et al., 1996). Vector stocks were delivered by stereotactic injection into the midbrain [mediolateral (ML) 4.0, anteroposterior (AP) 3.5, and dorsoventral (DV) 6.8; ML 4.0, AP 3.7, and DV 6.8 (Paxinos and Watson, 1986); AP is relative to the interaural line, ML is relative to the sagittal suture, and DV refers to the distance traveled from the dural membrane with a 20° angle for the needle toward the midline] of male Sprague Dawley rats (100–125 gm). These rats are smaller than those used for the atlas (Paxinos and Watson, 1986), and the injection sites were located just dorsal to the posterior SNc, as verified by cresyl violet staining. Each rat received a total of 6 × 10⁴ IVP (two sites and 3 μl/site for 6 μl of total volume; 1 × 10⁴ IVP/μl); each injection was performed slowly and evenly over ∼5 min.
We have shown previously (Song et al., 1997) that pTHlac targets expression 10-fold to SNc neurons, as compared with pHSVlac, which uses the HSV-1 IE 4/5 promoter. At 4 d after the injection of pTHlac we observed ∼950 X-gal positive cells per rat, ∼40% SNc neurons [assayed by double staining for either X-gal and TH-immunoreactivity (IR) or Escherichia coli β-galactosidase-IR and TH-IR], and with pHSVlac we observed ∼1500 positive cells per rat, ∼4% SNc neurons (Song et al., 1997). We found (Song et al., 1997) that the stability of expression (average positive cells per rat at 6 weeks divided by average positive cells per rat at 4 d) was 44% for pTHlac (not a statistically significant decrease) and 3% for pHSVlac. Additionally, after the injection of pTHlac, no positive cells were observed in other catecholaminergic areas (e.g., ventral tegmentum, locus coeruleus) or in the striatum, and injection of pHSVlac resulted in very few positive striatal cells (Song et al., 1997). Localized gene transfer with limited retrograde transport to distant neurons also was observed after vectors were delivered into either the striatum (During et al., 1994) or the hippocampus (Wood et al., 1994).
Rotational behavior was tested after the administration of apomorphine (2.5 mg/kg, s.c.). In some tests, fluphenazine (0.2 mg/kg, s.c.) was administered 3 hr before the apomorphine (Bruno et al., 1985). The net rotations performed during each 5 min period for 1 hr after apomorphine administration were measured by a computer-controlled rotameter (Omnitech Electronics, Columbus, OH; Ungerstedt and Arbuthnott, 1970). The net rotations performed during each 5 min period by each rat in a group were used to calculate the averages and totals shown in Figures 2and 4 and in Table 4. Behavioral data were analyzed by ANOVA and Newman–Keuls tests.
Fig. 2.

Apomorphine-induced rotational behavior after microinjection of pTHpkcΔ, control vectors, or PBS. The number of rotations was measured during each 5 min period for 1 hr after apomorphine administration. The rats were tested for apomorphine-induced rotational behavior before gene transfer (pretest). From 4 to 7 d later, pTHpkcΔ, pTHpkcΔGG, pHSVpkcΔ, pTHlac, or PBS was injected into the midbrain. Apomorphine-induced rotational behavior was measured at 1, 2, and 3 weeks after gene transfer. On week 4, fluphenazine, a DA receptor antagonist, was administered 3 hr before apomorphine-induced rotational behavior was tested (Bruno et al., 1985). On week 5, rats in the pTHpkcΔ and pTHlac groups were retested for apomorphine-induced rotational behavior. A, For the rats in the pTHpkcΔ group, shown is the average number of rotations performed during each 5 min period in each of five tests (pretest andweeks 1–4). These rotations were in the ipsilateral direction. B, For the rats in the pTHpkcΔ and control groups, shown is the average over three tests (weeks 1–3) of the average number of rotations performed during each 5 min period.
Fig. 4.

Apomorphine-induced rotational behavior as a function of the number of flag-IR positive SNc cells. The average of the total number of rotations performed during each of three tests (weeks 1–3) is plotted for each of 11 rats that received pTHpkcΔ as a function of the number of flag-IR positive cells in each rat. Least-squares regression analysis of these data (with and without values from the rat indicated by the circled square) yielded correlation coefficients of r = 0.74 (p < 0.01; solid line) andr = 0.89 (p < 0.001;dashed line), respectively.
Table 4.
Total apomorphine-induced rotations (mean ± SEM)
| Test | pTHpkcΔ (n = 24) | pTHpkcΔGG (n = 13) | pTHlac (n = 17) | PBS (n = 13) | pHSVpkcΔ (n = 13) |
|---|---|---|---|---|---|
| Pretest | −6 ± 4 | 1 ± 2 | −2 ± 4 | −2 ± 6 | −2 ± 3 |
| 1 | 66 ± 17* | 6 ± 4 | 2 ± 7 | 0 ± 13 | 17 ± 12 |
| 2 | 79 ± 19* | 18 ± 10 | 6 ± 10 | 0 ± 30 | 24 ± 11 |
| 3 | 86 ± 18* | 12 ± 7 | 10 ± 9 | 1 ± 32 | 14 ± 11 |
| 4 (+ Flu) | 0 ± 0 | 0 ± 0 | 0 ± 0 | 1 ± 1 | 0 ± 0 |
| 5 | 56 ± 184-a | 16 ± 13 |
Apomorphine-induced rotational behavior was measured in groups of rats 4–7 d before (pretest) and at weekly intervals after microinjection of pTHpkcΔ, control vectors, or PBS. Fluphenazine (Flu) was administered 3 hr before apomorphine on week 4.
* p < 0.05 versus pretest or control vector or PBS; ANOVA followed by Neuman–Keuls test.
n = 20; p < 0.05 versus pretest.
Immunohistochemistry. The rats were anesthetized with chloral hydrate (400 mg/kg, i.p.) and perfused with 50 ml of PBS, pH 7.4, followed by 200 ml of 4% paraformaldehyde in PBS. The brains were cryoprotected, coronal sections (25 μm) were cut on a freezing microtome, and immunohistochemistry was performed on free-floating sections. Sections were preincubated in PBS and 0.3% H2O2 (for 10 min at room temperature) and then rinsed with PBS (three times for 5 min each). Sections were permeabilized by incubation for 30 min at 37°C in PBS, 2% normal goat serum, and 0.2% Triton X-100 and then incubated overnight at 4°C in the same buffer with the primary antibody [mouse monoclonal anti-TH antibody (1:200 dilution), rabbit anti-flag antibody (0.15 μg/ml), or rabbit anti-HSV-1 particle antibody (1:2000 dilution)]. The sections were rinsed at room temperature with PBS and 0.2% Triton X-100 (three times for 10 min each) and then were incubated for 2 hr at room temperature in the same buffer with the secondary antibody [either biotinylated goat anti-mouse IgG antibody or biotinylated goat anti-rabbit IgG antibody (1:2000 dilution)]. The sections were rinsed at room temperature with PBS and 0.2% Triton X-100 (three times for 10 min each), incubated (at room temperature for 1 hr) with avidin-biotinylated peroxidase complex (ABC) reagent (Vector Laboratories, Burlingame, CA), and rinsed. Immunoreactivity was visualized with diaminobenzidine according to the manufacturer’s instructions.
With most of the rats, every eighth section was analyzed for TH-IR, every fourth section was analyzed for flag-IR positive cells, and ∼80 sections contained the SNc. The number of flag-IR positive SNc cells in each of 11 rats in the pTHpkcΔ group was determined by analyzing every section developed for flag-IR that contained the SNc. In some rats, HSV-1 particle-IR was analyzed in every eighth section. Positive cells were counted by locating the cell under 5 or 10× magnification and then verifying cellular morphology under 20 or 40× magnification.
Detection of recombinant RNAs. For RT-PCR, brain regions were dissected and rapidly frozen, and RNA was isolated (Ivins et al., 1993). To remove any contaminating DNA, we centrifuged the RNA through a CsCl gradient, we precipitated the resuspended pellet with a one-half volume of ethanol (selectively precipitates RNA), and we treated the remaining material with DNase (Ivins et al., 1993). Reverse transcriptase was used to transcribe 1 μg of the RNA into cDNA, which served as the template for PCR (Ivins et al., 1993). The conditions for the PCR were 39 cycles of 94°C for 2 min, of 60°C for 3 min, and of 72°C for 3 min, with a final extension time of 10 min at 72°C. The primer for reverse transcription, which also was used for PCR, was complementary to vector sequences in the 3′ untranslated region of the pkcΔ transcription unit (5′-TGACACCAGACCACTGGTAATGGT-3′), and the other primer for PCR was from pkcΔ [5′-AATGTGCCGGTGCCGCCGGAAG-3′; nucleotides 999–1020 of the rat PKCβII cDNA (Knopf et al., 1986)]. The PCR products were subjected to Southern analysis, using a radiolabeled oligonucleotide from pkcΔ (5′-ACAATGGCAACAGGGACCGGATGAAACTGA-3′; nucleotides 1129–1158 of the rat PKCβII cDNA).
For in situ hybridization, the rats were perfused with 4% paraformaldehyde (see Immunohistochemistry, above), and coronal brain sections (20 μm) were cut on a freezing microtome. Sections on glass slides were post-fixed with 4% paraformaldehyde, followed by graded concentrations of ethanol. The hybridization probe was complementary tolacZ nucleotides 3016–3079 (Kalnins et al., 1983) present in the 3′ untranslated region of the vectors (see Vectors, above) and was synthesized by in vitro transcription [T3 RNA polymerase, digoxigenin-conjugated UTP (Boehringer Mannheim)] of PCR products [template, pHSVlac; 5′ primer, 5′-AAAAAGAATTCCAGCTGAGCGCCGG-3′ (5 A and lacZ nucleotides 3016–3035); 3′ primer, 5′-AATTAACCCTCACTAAAGGGAAGAAATACGGGCAGACATGGCC-3′ (a T3 polymerase promoter [Sommer et al., 1990] and 20 nucleotides complementary to SV40 early region polyadenylation sequences)]. After in situ hybridization (Grant et al., 1993), the signal was visualized with an alkaline phosphatase-conjugated rabbit anti-digoxigenin antibody (1:500 dilution) and the BCIP/NBT substrate (Boehringer Mannheim) with levamisole (Vector Laboratories). Sections were counterstained with methyl green and coverslipped with aqueous mounting medium.
Detection of vector DNAs. Sections adjacent to those used for immunohistochemistry were analyzed. The midbrain was extracted (0.5 mg tissue/μl) in proteinase K (1 mg/ml) buffer (Higuchi, 1989). Samples were subjected to nested PCR, using primer pairs that recognize the pkcΔ transcription unit, but not the rat PKCβ gene. The primers for the first reaction were 5′-AGGAGGAACGTCCTCGTCGATAAGC-3′ [20 nucleotides from the HSV IE 4/5 intron (HSV-1 nucleotides 132,539–132,558 [McGeoch et al., 1988]), followed by five nucleotides from the sequence surrounding the ATG (see Vectors, above)] and 5′-TGGTTTATAAGGTGGCTGAATCTCC-3′ (complementary to nucleotides 1973–1997 of the rat PKCβII cDNA). The primers for the second reaction were 5′-CTACAAAGACGATGACGATAAATCG-3′ (from the flag sequence) and 5′-TTCGAGTTTCTCCCAGTCGATATACC-3′ (complementary to nucleotides 1942–1967 of the rat PKCβII cDNA). The conditions for both reactions were 40 cycles of 94°C for 1 min, of 55°C for 1 min, and of 72°C for 4 min. The reaction products were displayed on a 1.2% agarose gel.
DA receptor radioligand-binding assays. After rapid decapitation, the brains were removed quickly, frozen in isopentane at −15 to −20°C for ∼2 min, and stored at −20°C. Sections (20 μm) were cut on a cryostat, thaw-mounted onto gelatin-coated slides, desiccated, and stored at −20°C. Sections were preincubated in TBSI [containing (in mm) 50 Tris-HCl, pH 7.4, 120 NaCl, 5 KCl, 2 CaCl2, and 1 MgCl2] at room temperature for 5 min. To quantify the number of receptors of the D2 subfamily, we incubated sections at room temperature for 60 min in TBSI containing 0.7 nm[3H]spiperone (123.0 Ci/mmol; Amersham, Arlington Heights, IL) and 40 nm ketanserin (Janssen Pharmaceuticals, Titusville, NJ) to block radioligand binding to 5-HT2 receptors. After incubation, the slides were rinsed (two washes for 20 sec each) in ice-cold TBSIA (TBSI plus 0.02% ascorbic acid) and then in ice-cold H20 (one wash for 20 sec) and rapidly dried by aspiration and mild heating. Nonspecific [3H]spiperidol binding, defined with 1 μm (+)butaclamol (Research Biochemicals, Natick, MA), constituted ∼25% of the total binding. To quantify the number of receptors of the D1 subfamily, we preincubated sections as above, incubated them for 60 min in TBSIA containing 1.0 nm [3H]SCH23390 (87.0 Ci/mmol; New England Nuclear), and rinsed and dried them as described above. Nonspecific binding, defined with 5 μm(+)butaclamol, was ∼10% of the total binding.
To quantitate DA receptor densities, we apposed slides and [3H]-containing plastic standards (American Radiolabeled Chemicals, St. Louis, MO) to [3H]-sensitive Hyperfilm (Amersham) for 12–14 d at −20°C and developed the film with Kodak (New Haven, CT) D19 developer. Autoradiographic images were analyzed by computer-assisted densitometry (MCID; Image Research, St. Catherine’s, Ontario, Canada). Density was linearized by calibration against the appropriate radiolabeled plastic standards. The contribution of nonspecific binding was removed from the images of total binding, using a pixel-by-pixel subtraction routine, to yield images of specific binding. Binding density was quantified from these specific binding images, and readings were taken from the four quadrants of the anterior, medial, and posterior caudate putamen in each hemisphere. The binding data were analyzed by ANOVA, followed by post hoc comparisons.
RESULTS
Mutations in PKC
To enable genetic activation of PKC pathways in neurons, we isolated a constitutively active mutant of PKC. Rat PKCβII [673 amino acids (aa)] contains a regulatory domain (aa 1–339) and a catalytic domain (aa 340–603) (Knopf et al., 1986; Hanks et al., 1988). Five candidate deletions of the PKCβII cDNA, encoding proteins that extend from aa 194, 204, 231, 245, or 285 to the C terminus of PKCβII, were isolated. To allow for the detection of these recombinant PKCs in the presence of endogenous PKCs, we fused the 5′ ends of these candidate deletions to 10 codons that encode the flag epitope tag (Prickett et al., 1989). PC12 cells were infected with HSV-1 vectors designed to express each of the candidate deletions, and 1 d later flag-IR positive cells were visualized. Expression of the deletion that encodes aa 285 to the C terminus of PKCβII resulted in the highest level of flag-IR (data not shown); the gene and protein were designated pkcΔ and PkcΔ, respectively, and pkcΔ was used in the subsequent experiments.
As shown in Figure 1, PkcΔ and PkcΔGG (a Lys-to-Gly point mutation designed to lack enzyme activity; see Vectors above) were detected readily in PC12 cells infected with either pHSVpkcΔ or pHSVpkcΔGG. A Mr ∼50,000 band (calculated molecular weight 45,800) was detected by Western blots with either affinity-purified rabbit anti-flag antibody or anti-PKCβII antibody (Fig. 1A), and flag-IR positive cells were detected by immunocytochemical analysis with either a rabbit anti-flag antibody (Fig. 1B,C) or a mouse monoclonal anti-flag antibody (data not shown). PkcΔAA (a Lys-to-Arg point mutation) also was detected by using these methods (data not shown).
Fig. 1.
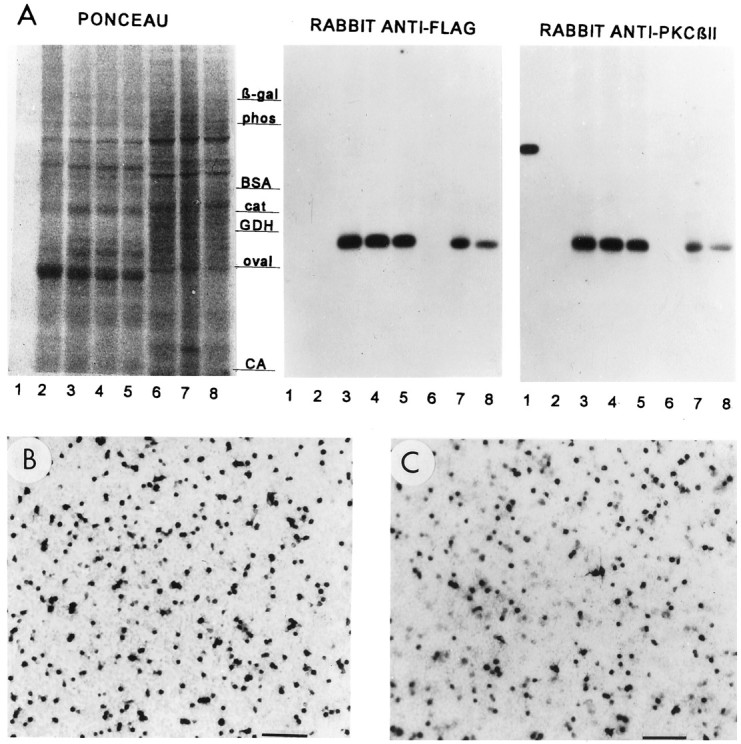
Western blots and immunocytochemical analyses of PkcΔ, PkcΔGG, and PkcΔAA in S. cerevisiae and PC12 cells. A, Replicate sets of aliquots of SDS-solubilizedS. cerevisiae and PC12 cells were subjected to SDS-polyacrylamide gel electrophoresis, followed by blot immunolabeling analysis. Protein staining is shown in the left panel(PONCEAU), and immunoreactivities with the indicated antibodies are shown in the right panels.Lane 1, Purified rat brain PKC; lanes 2–5, extracts from S. cerevisiae harboring no YEp51 plasmid, YEp51pkcΔ, YEp51pkcΔAA, or YEp51pkcΔGG, respectively; lanes 6–8, extracts from PC12 cells 1 d after infection with pHSVlac, pHSVpkcΔ, or pHSVpkcΔGG, respectively. The molecular weight markers are β-gal, β-galactosidase (116 kDa); phos, phosphorylase b (97 kDa); BSA, bovine serum albumin (67 kDa);cat, catalase (60 kDa); GDH, glutamate dehydrogenase (55 kDa); oval, ovalbumin (42 kDa); andCA, carbonic anhydrase (29 kDa). B, C,Flag-IR positive cells 1 d after PC12 cells were infected with either pHSVpkcΔ (B) or pHSVpkcΔGG (C). Scale bars, 333 μm.
PkcΔ exhibits a substrate specificity similar to rat brain PKC
As shown in Figure 1A, pkcΔ, pkcΔAA, and pkcΔGG were expressed at relatively comparable levels in the yeastS. cerevisiae, using the YEp51 vector (Riedel et al., 1993). As measured by using a peptide substrate for PKC derived from the MARCKS protein (Stumpo et al., 1989), PKC activity was detected only in the extracts of S. cerevisiae that harbored YEp51pkcΔ and not in extracts from S. cerevisiae that harbored either YEp51pkcΔAA or YEp51pkcΔGG (Table 1). Also, as shown in Table 2, the relative selectivity of protein kinase activity in the extracts of S. cerevisiae expressing pkcΔ was comparable to that exhibited by purified catalytic fragment of rat brain PKC (made constitutively active by partial digestion with trypsin).
Table 1.
PkcΔ, but not PkcΔAA or PkcΔGG, phosphorylates the MARCKS peptide
| YEp51 plasmid inS. cerevisiae | Relative 32P incorporation | |
|---|---|---|
| — | PKC inhibitor | |
| YEp51pkcΔ | 100 | 44 |
| YEp51pkcΔAA | 7 | 8 |
| YEp51pkcΔGG | 6 | 6 |
| None | 8 | 7 |
Aliquots (20 μg of protein) of S. cerevisiaeextracts were assayed for protein kinase activity, using 100 μm MARCKS (154–165) peptide (KKRFSFKKSFKL-NH2 as substrate. Assays were performed in the absence or presence of the PKC pseudosubstrate inhibitor peptide [PKC (19–36); RFARKGALRQKNVHEVKN-NH2 (House and Kemp, 1987)]. Based on Western blots, the levels of PkcΔAA and PkcΔGG protein were approximately threefold higher than those of PkcΔ in these samples.
Table 2.
PkcΔ and rat brain PKC have similar substrate specificities
| Peptide substrate | Protein kinase specificity2-a | Relative32P incorporation | |
|---|---|---|---|
| PkcΔ | Rat brain PKC | ||
| MARCKS (154–165) | PKC | 100 | 100 |
| PKC (19–31) | PKC | 31 | 35 |
| GS (1–8) | PKC, others | 97 | 81 |
| S6 (232–239) | PKC, others | 18 | 21 |
| Ca/CaM-PKII (281–291) | Ca/CaM-PKII | 3 | 2 |
| MBP (94–102) | MAPKs | 0 | 1 |
| Kemptide | PKA | 1 | 2 |
Aliquots of extracts from S. cerevisiae harboring YEp51pkcΔ and of proteolytically activated rat brain PKC containing equivalent amounts of MARCKS peptide kinase activity were assayed for protein kinase activity toward the indicated substrates (80 μm). Under these conditions, 32P incorporation was linear with respect both to the amount of added extract or kinase and to the time of the reaction. The sequences of the peptide substrates are PKC (19–31), RFARKGSLRQKNV-NH2, from the PKC pseudosubstrate sequence in PKC with S substituted for A; GS (1–8), PLSRTLSVAAKK-NH2, residues 1–8 of glycogen synthase with AAKK appended to promote binding to P81 paper; S6 (232–239), RRLSSRLA-NH2, from ribosomal S6 protein; Ca/CaM-PKII (281–291), MHRQETVDCLK-NH2, from the T286 autophosphorylation site; MBP (94–102), APRTPGGRR, from the MAPK phosphorylation site in myelin basic protein with GGRR appended to promote binding to P81 paper; and kemptide, LRRASLG, from the PKA phosphorylation site in pig liver pyruvate kinase.
PkcΔ causes a long-lasting, activation-dependent increase in catecholamine release
To determine whether PkcΔ could alter neuronal physiology, we measured neurotransmitter release from cultured sympathetic cells (1 d after infection) as the increase in efflux of either endogenous DA or previously accumulated [3H]-NE produced by elevated (depolarizing) levels of K+ in the release buffer. As shown in Table 3, elevated K+ (56 mm) produced substantially more DA release from cells infected with pHSVpkcΔ, and this effect was dependent on extracellular Ca2+ (data not shown). However, neither endogenous NE nor endogenous DA under the other conditions could be quantitated (for lack of sensitivity). Subsequent experiments examined the release of [3H]-NE from cultures in which endogenous pools were prelabeled via high-affinity uptake. As shown in Table 3, previous infection with pHSVpkcΔ resulted in a modest but reliable increase in basal efflux and a larger, 35–50% increase in K+-dependent release (30 mm K+). The K+-dependent release of [3H]-NE was calcium-dependent in each condition (data not shown). In separate cultures, flag-IR was detected in cells that displayed either neurofilament-IR or glial morphology (data not shown); however, a glial provenance of DA and NE seems unlikely because glia do not take up, store, or release significant amounts of catecholamines (Hansson, 1983). Additionally, the flag-IR in cells displaying a neuronal phenotype usually was restricted to the cell bodies and proximal processes.
Table 3.
pHSVpkcΔ increases catecholamine release from cultured sympathetic neurons
| Condition | Endogenous DA | [3H]-NE | ||
|---|---|---|---|---|
| Basal efflux | K+-dependent release | Basal efflux | K+-dependent release | |
| pg/min per 106 cells | Percentage of mock | |||
| Mock | <1.0 | <1.0 | 100 | 100 |
| pHSVpUC3-a | <1.0 | <1.0 | ||
| pHSVlac | 101 | 108 | ||
| pHSVpkcΔ | <1.0 | 21, 23 | 112 | 152 |
The levels of endogenous DA in the medium from separate cultures (two each for efflux and release per condition) were determined. As measured previously (Geller et al., 1993), these cells contain ∼2100 pg DA/106 cells. The values for [3H]-NE efflux and release represent the averages from two experiments (five cultures total for each condition). Mean [3H]-NE accumulation per culture differed by < 20% across conditions within each experiment. The values for basal efflux and K+-dependent release of [3H]-NE after mock inoculation were 0.57 and 0.28%, respectively.
pHSVpUC expresses the pUC19 polylinker (Geller et al., 1993).
Expression of pkcΔ in SNc neurons causes changes in apomorphine-induced rotational behavior
Our hypothesis was that expression of pkcΔ in SNc neurons might alter the physiology of the nigrostriatal DA system, with consequent effects on motor behavior. Because PkcΔ produced a long-lasting, activation-dependent increase in catecholamine release from cultured neurons, we reasoned that physiological activation of SNc neurons that contain PkcΔ might result in increased DA release from the striatal varicosities/terminals of the affected neurons. Changes in striatal DA levels are known to alter striatal DA receptor levels and/or sensitivity, and such changes in the levels/sensitivity of DA receptors unilaterally can be revealed by treatment with a DA receptor agonist, such as apomorphine, resulting in asymmetrical rotational behavior (Ungerstedt and Arbuthnott, 1970; Creese and Snyder, 1977; Neve et al., 1984). Unilateral lesions of SNc neurons result in decreased striatal DA levels, increased striatal DA receptors levels, and rotations in the contralateral direction. Thus, the lesion model predicts that expression of pkcΔ in SNc neurons unilaterally would increase striatal DA release, decrease the levels/sensitivity of striatal DA receptors, and result in apomorphine-induced rotational behavior in the ipsilateral direction. However, other predictions can be supported. For instance, some investigators have reported that drugs that increase DA release also increase striatal DA receptor levels (Klawans et al., 1979; Wilner et al., 1980). Furthermore, spontaneous rotational behavior is associated with specific and distinct changes in striatal DA receptor levels (Jerussi and Glick, 1976; Glick et al., 1981). In light of these contradictory results concerning changes in striatal DA receptor levels, we predicted that expression of pkcΔ in SNc neurons unilaterally would increase striatal DA release, cause a change (either an increase or a decrease) in the levels of striatal DA receptors, and cause apomorphine-induced rotational behavior in the ipsilateral direction.
This hypothesis was tested by using the TH promoter to target the expression of pkcΔ to SNc neurons and then measuring the effect on apomorphine-induced rotational behavior. On the basis of previous results (Song et al., 1997) (see Stereotactic Injections and Behavioral Testing above), which demonstrated that midbrain injections of a HSV-1 vector containing the TH promoter (pTHlac) target expression to SNc neurons (10-fold as compared with pHSVlac, which contains the HSV IE 4/5 promoter), vectors expressing either pkcΔ or pkcΔGG from the TH promoter (pTHpkcΔ and pTHpkcΔGG, respectively) were isolated. Before gene transfer, most rats exhibited minimal apomorphine-induced rotational behavior (Fig.2A, Table4). From 5 to 7 d later, pTHpkcΔ, pTHpkcΔGG, pHSVpkcΔ, pTHlac, or vehicle alone (PBS) was injected into the midbrain of these rats. Apomorphine-induced rotational behavior was measured at 1, 2, and 3 weeks after gene transfer. The rats in the pTHpkcΔ group displayed increases in both the maximum rotation rate (Fig. 2) and the total number of rotations (Table 4), which were in the direction ipsilateral to the microinjection. The increase in the number of rotations was statistically significant when compared with either the number of rotations before gene transfer or the number of rotations exhibited by the rats in the control groups (Table 4). In contrast, rats in the control groups (pTHpkcΔGG, pHSVpkcΔ, pTHlac, or PBS) displayed no statistically significant changes in rotational behavior (Fig. 2B, Table 4), demonstrating that the change requires both enzymatically active PkcΔ and its targeted expression to SNc neurons. At week 4 after gene transfer, the administration of fluphenazine, a DA receptor antagonist, before apomorphine blocked the apomorphine-induced rotational behavior (Fig. 2A, Table 4). Moreover, rotational asymmetry was shown to persist by retesting the rats in the pTHpkcΔ and pTHlac groups with apomorphine only at week 5 (Table 4).
Recombinant gene expression in the midbrain
Flag-IR positive cells were detected at 4 d after gene transfer as well as after completion of the behavioral analysis. Low-power photomicrographs of adjacent sections from rats killed at 4 d after gene transfer with pTHpkcΔ show a number of flag-IR positive cells present in the SNc (Fig.3B), as delineated by TH-IR (Fig. 3A). A high-power view shows that the flag-IR is located in the cell bodies and proximal processes of cells that display a neuronal morphology (Fig. 3C). Flag-IR was assayed at 6 weeks after gene transfer with pTHpkcΔ in some of the rats that had undergone behavioral testing: a low-power photomicrograph shows ∼12 flag-IR positive SNc cells (Fig. 3D) and a higher power view shows a cell with flag-IR in the cell body (Fig. 3E). The flag-IR positive SNc cells also had neuronal morphology (Fig.3F–H). From 4 to 6 weeks after gene transfer with pTHpkcΔGG, flag-IR positive SNc cells with neuronal morphology were detected (data not shown). These results are similar to our previous results (Song et al., 1997), which showed that, at 4–6 weeks after the injection of pTHlac, both X-gal positive and β-galactosidase-IR positive SNc cells with neuronal morphology were observed. The level of expression from the TH promoter declined somewhat over time with pTHpkcΔ. At 4 d after gene transfer the flag-IR usually extended to the proximal processes (Fig. 3B,C), but by 4–6 weeks the flag-IR frequently was restricted to the cell body (Fig.3D–H), and we have reported an analogous decline in the level of expression, using pTHlac (Song et al., 1997). The two injection sites were located proximal to the posterior SNc, and after injection of pTHlac, pTHpkcΔ, or pTHpkcΔGG, the majority of the cells that contained recombinant gene products was located in the posterior region of the SNc (data not shown).
Fig. 3.
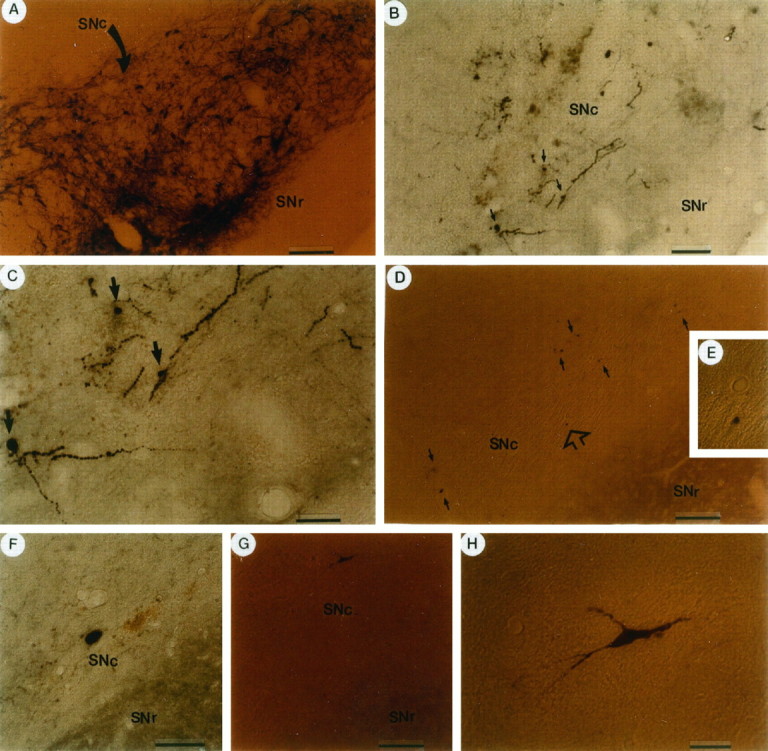
TH-IR positive cells and flag-IR positive cells with neuronal morphology at either 4 d or 6 weeks after gene transfer with pTHpkcΔ. pTHpkcΔ was injected into the midbrain; either 4 d (A–C) or 6 weeks (D–H) later (after the behavioral analysis), adjacent sections were analyzed for TH-IR and flag-IR positive cells. The SNc was located in sections by visualizing the TH-IR positive cells (A). A low-power view of an adjacent section (B) shows flag-IR positive cell bodies and proximal processes in SNc, but not in SNr. Three flag-IR positive cell bodies are indicated by arrows, and a high-power view (C) shows that these three cells display neuronal morphology, including neuronal-like processes. D, A low-power view shows ∼12 flag-IR positive cells in the SNc at 6 weeks after gene transfer. Eacharrow indicates one to several flag-IR positive cells, and the flag-IR positive cell indicated by the empty arrow is shown under medium power in E.F, High-power view of a flag-IR positive SNc cell with a large cell body, characteristic of a SNc neuron, from a second rat.G, H, Low- and high-power views of a flag-IR positive SNc cell, with processes characteristic of a SNc neuron, from a third rat. SNc, Substantia nigra pars compacta;SNr, substantia nigra pars reticulata. Scale bars:A and D, 80 μm; B, 45 μm; C, 25 μm; F, 20 μm;G, 50 μm; H, 10 μm.
The number of flag-IR positive cells, determined by cell counts, represented a small percentage of the number of neurons in the SNc. At 4–6 weeks after gene transfer using pTHpkcΔ, we observed ∼20–100 flag-IR positive SNc cells, and we have reported previously that the use of pTHlac resulted in ∼100–500 X-gal positive SNc cells (Song et al., 1997). A likely explanation for the approximately fivefold higher number of X-gal positive cells than flag-IR positive cells is that the flag-IR assay is not so sensitive as the X-gal assay. It is unlikely that the pkcΔ transcription unit RNA is highly unstable, because this RNA was detected by both RT-PCR and in situ hybridization (see next section). It is also unlikely that the constitutively active PKC caused a downregulation of the TH promoter in the vector, because similar numbers of flag-IR positive SNc cells were observed after the injection of equal titers of either pTHpkcΔ or pTHpkcΔGG. Expression from pTHpkcΔ was relatively stable, and approximately two- to threefold more flag-IR positive cells were observed at 4 d as compared with 4–6 weeks after gene transfer, similar to the results previously obtained with pTHlac [approximately twofold more X-gal positive cells at 4 d as compared with 6 weeks (Song et al., 1997)]. Thus, it is probable that pTHpkcΔ supported the expression of pkcΔ in ∼0.1–2% (correcting for the sensitivity of the flag-IR assay) of the ∼22,000 neurons in the SNc (Poirier et al., 1983) throughout the experimental period.
The relationship between the number of flag-IR positive cells and the amount of rotational behavior was examined by using data from individual rats in the pTHpkcΔ group. The number of flag-IR positive SNc cells was determined in each of 11 rats (killed at 4–6 weeks after gene transfer), and the average of the total number of rotations for weeks 1, 2, and 3 was calculated for each rat. Of note, the number of flag-IR positive SNc cells displayed a statistically significant correlation with the amount of rotational behavior (Fig.4).
The location of the flag-IR positive cells was compared after the injection of pTHpkcΔ or pHSVpkcΔ. At 4 d after gene transfer with pTHpkcΔ, approximately one-half of the flag-IR positive cells were located in the SNc (see Fig. 3); in contrast, with pHSVpkcΔ, only ∼5% of flag-IR positive cells were located within the SNc (data not shown). Similarly, we previously reported that at 4 d after the injection of pTHlac or pHSVlac, respectively, 40 or 4% of the X-gal positive cells contained TH-IR (Song et al., 1997). Other differences in the expression of pkcΔ from pTHpkcΔ and pHSVpkcΔ offer little more to explain why only pTHpkcΔ altered rotational behavior; because expression from the IE 4/5 promoter is relatively unstable [pHSVlac, ∼30-fold decrease in the number of positive cells between 4 d and 6 weeks after gene transfer (Song et al., 1997)] and because the flag-IR assay was not so sensitive as the X-gal assay, few flag-IR positive cells were observed at 4–6 weeks after gene transfer with pHSVpkcΔ, although pkcΔ transcription unit RNA was still detected (see next section). Of note, analogous to results obtained with pHSVlac and pTHlac (Song et al., 1997), more flag-IR positive cells were observed with pHSVpkcΔ than with pTHpkcΔ at 4 d after gene transfer, but at 1 week after gene transfer only pTHpkcΔ directed rotational behavior (see Fig. 2, Table 4). Additionally, although pTHpkcΔ and pHSVpkcΔ may express different levels of pkcΔ transcription unit RNA because of their different promoters, PkcΔ is constitutively active, and threshold levels sufficient to cause physiological effects are likely to be low. Thus, expression of pkcΔ must be targeted to SNc cells to cause rotational behavior.
Detection of recombinant RNAs and persistence of vector DNAs
The long-term transcriptional activities of pTHpkcΔ and pHSVpkcΔ were analyzed by using both RT-PCR and in situhybridization. At 2–6 weeks after gene transfer, pkcΔ transcription unit RNA was detected in the midbrain (using RT-PCR), but not in the cerebellum, in each of three rats that received pTHpkcΔ and in each of three rats that received pHSVpkcΔ (Fig.5A). Such results are similar to those previously reported in which lacZ RNA was detected in the midbrain, but not in the cerebellum, at 6 weeks after gene transfer with pTHlac (Song et al., 1997). In situhybridization was used to localize pkcΔ transcription unit RNA. Two weeks after the injection of pTHpkcΔ, pkcΔ transcription unit RNA was detected in SNc cells from each of three rats that were analyzed (Fig. 5B,C), but pkcΔ RNA was not detected in SNc cells from one rat that received only helper virus (d120; data not shown).
Fig. 5.
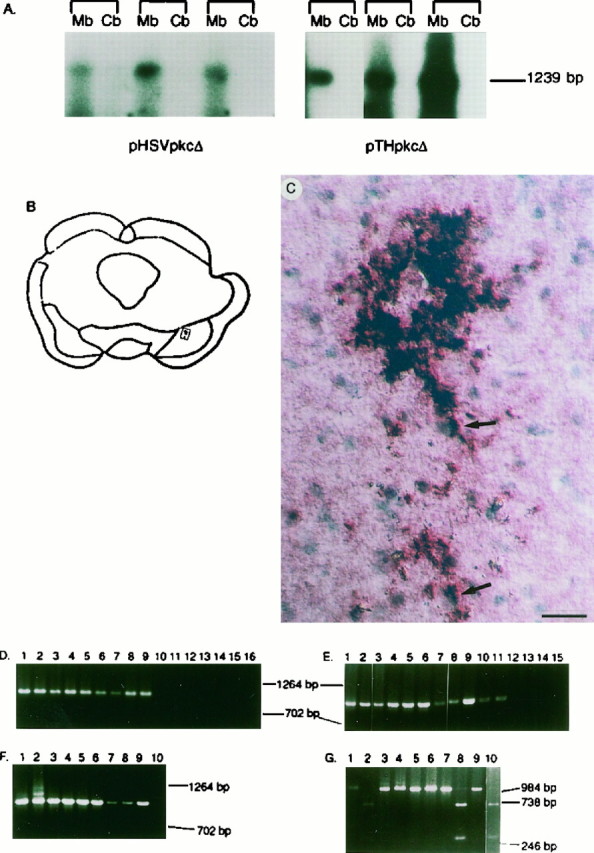
Long-term expression of pkcΔ transcription unit RNA from pTHpkcΔ and pHSVpkcΔ and the persistence of vector DNAs.A, Detection of pkcΔ transcription unit RNA by RT-PCR. At 2 weeks (pTHpkcΔ) or 6 weeks (pHSVpkcΔ) after injection into the midbrain, RNA was isolated from either the midbrain or the cerebellum. The RNA was treated with DNase, and reverse transcription was performed by using a primer from the 3′ untranslated region of the pkcΔ transcription unit. The reverse transcription reaction products were amplified by performing PCR with primers from the pkcΔ transcription unit. The PCR reaction products were detected by Southern blot analysis, using a radiolabeled oligonucleotide from the pkcΔ coding region. The predicted size of the RT-PCR products is 1239 bp.Mb, Midbrain; Cb, cerebellum. B, C, Detection of pkcΔ transcription unit RNA by in situ hybridization. At 2 weeks after the injection of pTHpkcΔ, in situ hybridization was performed with a digoxigenin-labeled probe. Hybridization was visualized by using an alkaline phosphatase-conjugated anti-digoxigenin antibody, and the nuclei were detected by counterstaining with methyl green.B, A camera lucida drawing of a section that was analyzed; the rectangle shows the location of a group of positive cells in the SNc. C, A high-power photomicrograph reveals a number of positive cells. Each of the twoarrows points to an area of hybridization signal proximal to a nucleus. Scale bar, 50 μm. D–G,Detection of vector DNAs by PCR. DNA was extracted from the midbrain in sections adjacent to those used for immunohistochemistry, PCR was performed with primers from the pkcΔ transcription unit, and the PCR reaction products were displayed on an agarose gel. The predicted size of the PCR reaction products is 1003 bp. D, All of the rats were analyzed at 4 d after gene transfer. Lanes 1, 2, pTHpkcΔ or pHSVpkcΔ DNA isolated fromE. coli, respectively; lanes 3–5, three rats that received pHSVpkcΔ; lanes 6–9, four rats that received pTHpkcΔ; lanes 10–12, three rats that received PBS; lane 13, plasmid PKC-II DNA [contains the rat PKCβII cDNA (Knopf et al., 1986)]; lane 14, no DNA; lanes 15, 16, no primers or noTaq polymerase, respectively, with pTHpkcΔ DNA isolated from E. coli. E–G, All of the rats were analyzed at 6 weeks after gene transfer. E, Lane 1, pTHpkcΔ DNA isolated from E. coli;lanes 2, 3, two rats that received pHSVpkcΔ; lanes 4–11, eight rats that received pTHpkcΔ; lane 12, one rat that received PBS; lane 13, plasmid PKC-II DNA; lanes 14, 15, no primers or no Taq polymerase, respectively, with pTHpkcΔ DNA isolated from E. coli. F, Lanes 1,2, pTHpkcΔGG or pTHpkcΔ DNA isolated from E. coli, respectively; lanes 3–6, four rats that received pTHpkcΔ (in addition to the eight rats in E);lanes 7–9, three rats that received pTHpkcΔGG;lane 10, one rat that received PBS. G, ABamHI site is predicted to be present in the PCR reaction products obtained by using pTHpkcΔGG, but not pTHpkcΔ, as the template; digestion with BamHI is expected to result in 288 and 715 bp fragments. The first two nucleotides in theBamHI site represent the last two nucleotides in the Gly codon in pkcΔGG that replaced the evolutionarily conserved Lys codon in pkcΔ. Lanes 1, 2, pTHpkcΔGG DNA isolated from E. coli, either undigested or digested with BamHI, respectively; lanes 3–6, two rats that received pTHpkcΔ, either undigested (lanes 3, 5) or digested with BamHI (lanes 4, 6); lanes 7–10, two rats that received pTHpkcΔGG, either undigested (lanes 7, 9) or digested withBamHI (lanes 8, 10).
Persistence of vector DNAs was demonstrated by performing PCR on DNA extracted from sections adjacent to those used for immunohistochemistry. At 4 d after gene transfer, pkcΔ transcription unit DNA sequences were detected in four rats that received pTHpkcΔ and three rats that received pHSVpkcΔ, but pkcΔ transcription unit DNA sequences were not detected in three rats that received PBS (Fig. 5C). At 6 weeks after gene transfer, pkcΔ transcription unit DNA sequences were detected in 12 rats that received pTHpkcΔ, three rats that received pTHpkcΔGG, and two rats that received pHSVpkcΔ, but no signal was detected in two rats that received PBS (Fig. 5D,E). The mutation in pTHpkcΔGG was preserved: a BamHI site was created in constructing pkcΔGG from pkcΔ, and the last two nucleotides of the inserted Gly codon represent the first two nucleotides of the BamHI site. The PCR products produced from DNA of two rats that received pTHpkcΔGG were cleaved by BamHI to yield two bands with the predicted sizes, but the PCR products obtained from the DNA of two rats that received pTHpkcΔ were resistant to digestion by BamHI (Fig. 5F). Similar results have been reported after gene transfer with either pTHlac or pHSVlac (Song et al., 1997).
Gene transfer with pTHpkcΔ results in changes in the striatal DA system
Following the hypothesis that the change in apomorphine-induced rotational behavior after gene transfer with pTHpkcΔ resulted from an increase in DA release from the SNc neuron axon varicosities/terminals in the striatum and consequent change in the levels of striatal DA receptors, we measured striatal extracellular fluid DA levels, usingin vivo microdialysis. The results from three preliminary experiments were inconsistent (data not shown), but because the projection from the SNc to the striatum is organized in a topographic manner (Fallon and Moore, 1978), the variable results could be attributable to relatively small differences among the rats in the location of the SNc cells subjected to gene transfer, coupled with variations in the location of the microdialysis probe in the striatum. Moreover, the changes in DA receptor levels that were observed (see below) are modest in size and localized to specific areas of the striatum, suggesting that it would be challenging to detect any corresponding changes in DA levels; consequently, the in vivo dialysis experiments were not pursued.
The levels of striatal DA receptors initially were assayed in homogenates of total striatum by using receptor-binding assays. Although no changes in either striatal D1 or D2DA receptor levels were apparent at 2 weeks after the injection of pTHpkcΔ into the midbrain (data not shown), analysis of the entire striatum may have obscured regionally restricted changes in the levels of DA receptors. Consequently, analysis via DA receptor autoradiography was undertaken, and 2 weeks after pTHpkcΔ, pTHpkcΔGG, or PBS was injected into the midbrain, the rats were killed. Cresyl violet staining revealed that the injection sites were located in the posterior SNc (data not shown), which projects to the posterior striatum (Fallon and Moore, 1978). An increase in D2 DA receptor densities, restricted to the posterior region of the striatum on the injected side of the brain, was observed in the pTHpkcΔ group (Table 5; this assay measures the D2 subfamily of receptors, D2, D3, and D4). The posterior striatal D2 receptor binding in the pTHpkcΔ group, but not the control groups, differed between control and injected hemispheres by ANOVA (p < 0.05). Furthermore, the increased D2 receptor binding in the posterior striatum of the rats that received pTHpkcΔ was statistically significant (p < 0.025) in the ventrolateral and ventromedial quadrants, but not in the dorsolateral and dorsomedial quadrants. The increase in D2 receptor levels was modest in size and was restricted to 2 of 12 striatal areas; consequently, if this same increase was averaged over the entire striatum, it is unlikely that it would be detected above background. Thus, the apparently contradictory results from the receptor binding and receptor autoradiography assays can be reconciled. Moreover, this localized change in D2 receptors is consistent with both the gene transfer that was achieved (see Stereotactic Injections and Behavioral Testing above) and the histological results (see Fig. 3); it would have been surprising if gene transfer to a small region of the SNc caused changes in DA receptor levels throughout the striatum. D1DA receptor binding was not changed in any striatal region by injection of pTHpkcΔ (data not shown; this assay measures the D1 subfamily of receptors, D1 and D5).
Table 5.
D2 DA receptor densities (fmol/mg protein) in the posterior striatum after injection into the midbrain of pTHpkcΔ, pTHpkcΔGG, or PBS
| Condition | Hemisphere | Ventromedial | Posterior striatal region | Dorsolateral | |
|---|---|---|---|---|---|
| Ventrolateral | Dorsomedial | ||||
| pTHpkcΔ | Injected | 321 ± 25* | 598 ± 73* | 299 ± 42 | 422 ± 61 |
| n = 4 | Noninjected | 284 ± 30 | 549 ± 73 | 280 ± 42 | 410 ± 57 |
| pTHpkcΔGG | Injected | 245 ± 25 | 499 ± 73 | 211 ± 42 | 324 ± 61 |
| n = 4 | Noninjected | 242 ± 30 | 521 ± 73 | 222 ± 42 | 344 ± 57 |
| PBS | Injected | 246 ± 28 | 550 ± 84 | 287 ± 48 | 424 ± 70 |
| n = 4 | Noninjected | 226 ± 34 | 563 ± 84 | 304 ± 48 | 433 ± 66 |
Two weeks after gene transfer, D2 DA receptor levels were determined in each of four quadrants in the anterior, medial, and posterior striatum. The D2 DA receptor levels (mean ± SEM) in the posterior striatum are shown here. D2 DA receptor density in the injected hemisphere was significantly greater than in the control hemisphere of rats in the pTHpkcΔ group (p < 0.05), but not in the control groups, as determined by ANOVA.
* p < 0.025, Newman–Keuls test.
Side effects of this HSV-1 vector system
The packaging system (Geller et al., 1990; Lim et al., 1996) used for the behavioral experiments, KOS strain d120 virus and E5 cells (DeLuca et al., 1985), has a low reversion frequency (<10−7) to wild-type HSV-1. After gene transfer, all of the rats appeared healthy, exhibited unaltered ingestive behavior and gained weight, exhibited normal motor behavior (except when tested with apomorphine), and survived until killed. On histological analysis, no brain tumors were observed, and there was no evidence of reactivation of HSV-1 because no HSV-1 particle-IR was detected at either 4 d or 4–6 weeks after gene transfer. A small lesion area was observed around the injection site (average of 1.2 mm2 in sections containing the injection site from four rats that received pTHlac). Unilateral destruction of SNc neurons causes both apomorphine-induced contralateral rotational behavior and increases in D2 DA receptor levels in the ipsilateral striatum (Ungerstedt and Arbuthnott, 1970; Creese and Snyder, 1977); however, no such changes were observed in the vector system control groups (pTHlac and pTHpkcΔGG).
DISCUSSION
A three-part genetic intervention strategy (Geller et al., 1991) was used to modify selectively the physiology of SNc neurons with consequent changes in apomorphine-induced rotational behavior. Our results demonstrate that this strategy has a number of attractive features and some limitations. Use of a dominant mutation allows this strategy to be used in wild-type animals, long-term expression supports analysis of long-term behavioral changes, and gene transfer into adult animals avoids potential complications from altered brain development. The selective manipulation of a specific type of neuron can be achieved by localized gene transfer and enhanced by using a vector that contains a cell type-specific promoter. Post hoc histological analysis allows for the affected neurons to be identified (although improved detection methods are desirable). Thus, elicited behaviors can be attributed to the altered function of identified neurons. Moreover, although the brain often has multiple circuits that can subserve a similar function, the selective activation of a particular pathway in a specific group of neurons, and consequently a particular circuit, enables analysis of the function of that particular circuit, whereas strategies based on disrupting a specific circuit must confront the possibility of other pathways subserving the control of that function.
In these experiments, HSV-1 vectors were microinjected into the midbrain, the TH promoter targeted expression to SNc neurons (Song et al., 1997), and a constitutively active PKC produced changes in the physiology of SNc neurons that were revealed by a DA receptor agonist. The resulting rotational behavior was evident by 1 week and persisted for at least 5 weeks, and the rotations were in the ipsilateral direction. By contrast, apomorphine-induced rotational behavior was not observed in rats that received PBS or pTHlac or even pTHpkcΔGG, which encodes a single amino acid mutant of PkcΔ lacking PKC activity.
Constitutively active PKCs, analogous to PkcΔ, occur naturally. Calpain, which is activated by the high levels of Ca2+ produced by repetitive synaptic activation, releases catalytic domains of PKC from the α, βI, βII, and γ isoforms (Kishimoto et al., 1989). Also, during LTP, hippocampal neurons contain a catalytic domain of PKCζ that is similar to the catalytic domains produced by calpain (Sacktor et al., 1993). PkcΔ and purified rat brain PKC display similar substrate specificities, and the catalytic domains of all PKC isoforms are highly homologous and display similar substrate specificities (Tanaka and Nishizuka, 1994). Thus, PkcΔ has a structure and activity similar to those of naturally occurring catalytic domains of PKCs.
In SNc cells, PkcΔ was detected in the cell body and proximal processes, but not in the ascending axons or processes within the striatum; in cultured neurons, PkcΔ usually was detected only in the cell body and proximal processes. Different PKC isoforms are localized to specific subcellular compartments within neurons or even specific types of neurons, and the subcellular localization signals are thought to be present in the regulatory domains (Tanaka and Nishizuka, 1994). Although a similar pattern of immunoreactivity could result from the inadequate sensitivity of the flag-IR assay, PkcΔ lacks a regulatory domain, and passive diffusion seems likely to account for any transport of PkcΔ from its presumed site of synthesis in the cell body, which also would explain the observed localization of PkcΔ. This apparent localization may be important for understanding how PkcΔ caused the observed changes in neuronal physiology.
PkcΔ enhanced the activation-dependent release of catecholamines from cultured neurons. This effect could be mediated directly by phosphorylation of proteins that are proximal/integral to the release machinery or indirectly by changes in the activity of distal proteins phosphorylated by PkcΔ. Consistent with a direct pathway, PKC phosphorylates specific proteins in the axon terminal, including GAP-43 (Akers and Routtenberg, 1985), and phorbol esters can increase release from neurons or synaptosomes (Pozzan et al., 1984; Nichols et al., 1987; Coffey et al., 1993). However, the apparent localization of PkcΔ to cell bodies and proximal processes is more consistent with an indirect pathway. There are numerous possible mechanisms for an indirect pathway; for example, because PKC phosphorylates specific voltage-gated ion channels, including the voltage-gated sodium channel (Numann et al., 1991), phosphorylation of a specific voltage-gated ion channel might alter neuronal conductivity and thereby alter release. Although PkcΔ also may mediate additional changes in neuronal physiology, the changes in neurotransmitter release that it produces bear striking similarity to those produced by phorbol esters and by repetitive synaptic activity (which produce PKC catalytic domains). Also, whether direct, indirect, or a combination of mechanisms is involved, this effect of PkcΔ on release is distinct from that produced by activation of the PKA pathway: activation of the PKA pathway by a constitutively active adenylate cyclase produced a long-lasting increase in basal efflux without affecting K+-stimulated release (Geller et al., 1993).
Histological and pharmacological data addressed both the type of neuron and the specific neurotransmitter system involved in mediating the apomorphine-induced rotational behavior produced by pTHpkcΔ. After the injection of pTHpkcΔ, pTHpkcΔGG, or pTHlac, SNc neurons were the only midbrain catecholaminergic neurons that contained recombinant gene products. Although some expression was observed in inappropriate cell types in the midbrain, no expression was detected in striatal cells. Moreover, the amount of rotational behavior correlated with the number of SNc cells that contained PkcΔ. The affected neurotransmitter system appears to have been dopaminergic because rotational behavior was elicited by a DA receptor agonist, and this effect was blocked by a DA receptor antagonist. Thus, we conclude that altered dopaminergic neurotransmission from SNc neurons mediated the observed changes in rotational behavior.
An obvious candidate for the identity and locus of altered dopaminergic neurotransmission is an activation-dependent increase in DA release from the striatal projections of affected SNc neurons. PkcΔ caused a long-lasting and activation-dependent increase in release from cultured sympathetic neurons, and D2 DA receptor density was increased selectively in those striatal regions innervated by the affected SNc neurons. This increase in DA receptor levels is consistent with the changes that some investigators report after the administration of drugs that increase DA release (Klawans et al., 1979;Wilner et al., 1980), but it is not predicted by the effects of unilateral lesion of the SNc or chronic blockade of DA receptors (Creese and Snyder, 1977; Muller and Seeman, 1977). However, predictions obtained from lesion experiments are not necessarily applicable to a genetic intervention paradigm in normal rats, both because removal of the SNc neurons causes a “gap” in the circuitry and because other substances besides DA that also are secreted (e.g., peptide neurotransmitters, growth factors) are no longer present. Furthermore, there is considerable evidence to suggest that factors in addition to DA receptor density contribute to the direction of rotation (Marshall et al., 1997). Moreover, PkcΔ may have multiple effects on the physiology of SNc neurons that interact to influence the direction of rotation. For example, SNc neurons can release DA from their cell soma and dendrites, and it is possible that such additional sites also may be involved.
The presence of PkcΔ in a small percentage (∼0.1–2%) of SNc neurons was sufficient to alter apomorphine-induced rotational behavior. Consistent with this observation, in normal animals the small imbalances in the nigrostriatal system between the two hemispheres appear to underlie spontaneous rotational behavior (Jerussi and Glick, 1976; Glick et al., 1981). Also, because the flag-IR positive cells were in the posterior SNc, the local concentration of affected neurons was probably higher than the overall average. Such localized concentrations of affected SNc neurons may be critical for causing both the localized changes in striatal D2 DA receptor levels and the change in apomorphine-induced rotational behavior.
pHSVpkcΔ did not alter apomorphine-induced rotational behavior, and this may be because the majority of the expression (∼95%, similar to results with pHSVlac) was in glia and in non-SNc neurons. Because glia do not take up, store, or release catecholamines (Hansson, 1983), activation of PKC pathways in glia seems an unlikely direct effector of changes in dopaminergic neurotransmission. However, PkcΔ in the non-SNc neurons could alter their physiology to counterbalance the effects of PkcΔ in the SNc neurons on apomorphine-induced rotational behavior. For example, pHSVlac and pHSVpkcΔ supported significant expression in SN reticulata (SNr) cells with neuronal morphology. Because SNr neurons that project to the SNc are GABAergic, it is conceivable that PkcΔ enhances GABA release at these synapses, thereby counterbalancing the effects of PkcΔ in SNc neurons.
Our results demonstrate that the three-part genetic intervention strategy used here has promise, but a number of questions remain unanswered. This strategy is critically dependent on the vector system, and the HSV-1 vector system used in this study is not without its problems, especially cytopathic effects and immune responses, caused primarily by the helper virus (Wood et al., 1994). A recently developed helper-virus-free packaging system has addressed many of these concerns (Fraefel et al., 1996); however, additional improvements are still required. Although it remains to be seen if this strategy can be applied to more complex behaviors, such as learning and memory, each of the established strategies for modifying brain physiology (including transgenic mice, cell transplantation, and surgical, pharmacological, and electrophysiological interventions) also has particular strengths and weaknesses. As such, the present strategy may prove to be equally useful.
Footnotes
This work was supported by the Pharmaceutical Manufacturers Foundation (S.S.); Council for Tobacco Research USA Grant 3129 (H.R.); National Institutes of Health (NIH) Grant NS25143 and Research Scientist Development Award MH00967 (J.H.); NIH Grant HD24236 (R.N.); NIH Grant AG10827 (A.G. and K.O.); NIH Grant NS34024, Neurovir, National Alliance for Research on Schizophrenia and Depression, and the Burroughs Wellcome Fund (A.G.). We thank Drs. N. DeLuca for both d120 virus and E5 cells, J. Knopf for the rat PKCβII cDNA, M. Leahy for the mouse anti-flag antibody, M. D. Browning for both the purified rat brain PKC and the constitutively active fragment obtained by partial digestion with trypsin, and A. Heller for MN9D cells. We also thank Ms. Courtney S. Holmes for technical assistance. We gratefully acknowledge Dr. Dean M. Hartley for constructing the first pTHpkcΔ vector and for helpful discussions with Dr. Song.
This manuscript is dedicated to the memory of Dr. Francis O. Schmitt (1903–1995).
Correspondence should be addressed to Dr. Alfred Geller, Division of Endocrinology, Children’s Hospital, Boston, MA 02115.
REFERENCES
- 1.Abeliovich A, Chen C, Goda Y, Silva AJ, Stevens CF, Tonegawa S. Modified hippocampal long-term potentiation in PKCγ-mutant mice. Cell. 1993a;75:1253–1262. doi: 10.1016/0092-8674(93)90613-u. [DOI] [PubMed] [Google Scholar]
- 2.Abeliovich A, Paylor R, Chen C, Kim JJ, Wehner JM, Tonegawa S. PKCγ mutant mice exhibit mild deficits in spatial and contextual learning. Cell. 1993b;75:1263–1271. doi: 10.1016/0092-8674(93)90614-v. [DOI] [PubMed] [Google Scholar]
- 3.Akers RF, Routtenberg A. Protein kinase C phosphorylates a 47 Mr protein (F1) directly related to synaptic plasticity. Brain Res. 1985;334:147–151. doi: 10.1016/0006-8993(85)90576-1. [DOI] [PubMed] [Google Scholar]
- 4.Arbuthnott GW, Ungerstedt U. Turning behavior induced by electrical stimulation of the nigro-striatal system of the rat. Exp Neurol. 1975;47:162–172. doi: 10.1016/0014-4886(75)90244-7. [DOI] [PubMed] [Google Scholar]
- 5.Bruno JP, Stricker EM, Zigmond MJ. Rats given dopamine-depleting brain lesions as neonates are subsensitive to dopaminergic antagonists as adults. Behav Neurosci. 1985;99:771–775. doi: 10.1037//0735-7044.99.4.771. [DOI] [PubMed] [Google Scholar]
- 6.Brown ER, Coker GT, O’Malley KL. Organization and evolution of the rat tyrosine hydroxylase gene. Biochemistry. 1987;26:5208–5212. doi: 10.1021/bi00390a046. [DOI] [PubMed] [Google Scholar]
- 7.Chen C, Kano M, Abelovich A, Chen L, Bao S, Kim JJ, Hashimoto K, Thompson RF, Tonegawa S. Impaired motor coordination correlates with persistent multiple climbing fiber innervation in PKCγ mutant mice. Cell. 1995;83:1233–1242. doi: 10.1016/0092-8674(95)90148-5. [DOI] [PubMed] [Google Scholar]
- 8.Coffey ET, Sihra TS, Nicholls DG. Protein kinase C and the regulation of glutamate exocytosis from cerebrocortical synaptosomes. J Biol Chem. 1993;268:21060–21065. [PubMed] [Google Scholar]
- 9.Creese I, Snyder SH. Dopamine receptor binding enhancement accompanies lesion-induced behavior supersensitivity. Science. 1977;197:596–598. doi: 10.1126/science.877576. [DOI] [PubMed] [Google Scholar]
- 10.Davidson I, Stow ND. Expression of an immediate early polypeptide and activation of a viral origin of DNA replication in cells contain a fragment of herpes simplex virus DNA. Virology. 1985;141:77–88. doi: 10.1016/0042-6822(85)90184-9. [DOI] [PubMed] [Google Scholar]
- 11.DeLuca NA, McCarthy AM, Schaeffer PA. Isolation and characterization of deletion mutants of herpes simplex virus type 1 in the gene encoding immediate-early regulatory protein ICP4. J Virol. 1985;56:558–570. doi: 10.1128/jvi.56.2.558-570.1985. [DOI] [PMC free article] [PubMed] [Google Scholar]
- 12.Diana M, Barcia-Munoz M, Richards J, Freed CR. Electrophysiological analysis of dopamine cells from substantia nigra pars compacta of circling rats. Exp Brain Res. 1989;74:625–630. doi: 10.1007/BF00247365. [DOI] [PubMed] [Google Scholar]
- 13.Dudai Y. The neurobiology of memory. Oxford UP; Oxford: 1989. [Google Scholar]
- 14.During MJ, Naegele J, O’Malley KL, Geller AI. Long-term behavioral recovery in a model of Parkinson’s disease by intrastriatal expression of tyrosine hydroxylase. Science. 1994;266:1399–1403. doi: 10.1126/science.266.5189.1399. [DOI] [PMC free article] [PubMed] [Google Scholar]
- 15.Fallon JH, Moore RY. Catecholamine innervation of the basal forebrain. IV. Topography of the dopaminergic projection to the basal forebrain and neostriatum. J Comp Neurol. 1978;180:545–580. doi: 10.1002/cne.901800310. [DOI] [PubMed] [Google Scholar]
- 16.Fraefel C, Song S, Lim F, Lang P, Yu L, Wang Y, Wild P, Geller AI. Helper virus-free transfer of HSV-1 plasmid vectors into neural cells. J Virol. 1996;70:7190–9197. doi: 10.1128/jvi.70.10.7190-7197.1996. [DOI] [PMC free article] [PubMed] [Google Scholar]
- 17.Geller AI, Breakefield XO. A defective HSV-1 vector expresses Escherichia coli β-galactosidase in cultured peripheral neurons. Science. 1988;241:1667–1669. doi: 10.1126/science.241.4873.1667. [DOI] [PMC free article] [PubMed] [Google Scholar]
- 18.Geller AI, Keyomarski K, Bryan J, Pardee AB. An efficient deletion mutant packaging system for defective HSV-1 vectors; potential applications to neuronal physiology and human gene therapy. Proc Natl Acad Sci USA. 1990;87:8950–8954. doi: 10.1073/pnas.87.22.8950. [DOI] [PMC free article] [PubMed] [Google Scholar]
- 19.Geller AI, During MJ, Neve RL. Molecular analysis of neuronal physiology by gene transfer into neurons with herpes simplex virus vectors. Trends Neurosci. 1991;14:428–432. doi: 10.1016/0166-2236(91)90040-2. [DOI] [PubMed] [Google Scholar]
- 20.Geller AI, During MJ, Haycock JW, Freese A, Neve RL. Long-term increases in neurotransmitter release from neuronal cells expressing a constitutively active adenylate cyclase from a HSV-1 vector. Proc Natl Acad Sci USA. 1993;90:7603–7607. doi: 10.1073/pnas.90.16.7603. [DOI] [PMC free article] [PubMed] [Google Scholar]
- 21.Glick SD, Weaver LM, Meibach RC. Amphetamine-induced rotation in normal cats. Brain Res. 1981;208:227–229. doi: 10.1016/0006-8993(81)90638-7. [DOI] [PubMed] [Google Scholar]
- 22.Gospe SM, Mora BJ, Glick SD. Measurement of spontaneous rotational movement (circling) in normal children. J Child Neurol. 1990;5:31–34. doi: 10.1177/088307389000500106. [DOI] [PubMed] [Google Scholar]
- 23.Grant FD, Reventos J, Gordon JW, Kawabata S, Miller M, Majzoub JA. Expression of the rat arginine vasopressin gene in transgenic mice. Mol Endocrinol. 1993;7:659–667. doi: 10.1210/mend.7.5.8100353. [DOI] [PubMed] [Google Scholar]
- 24.Greene LA, Tischler AS. Establishment of a noradrenergic clonal line of rat adrenal pheochromocytoma cells which respond to nerve growth factor. Proc Natl Acad Sci USA. 1976;73:2424–2428. doi: 10.1073/pnas.73.7.2424. [DOI] [PMC free article] [PubMed] [Google Scholar]
- 25.Hanks SK, Quinn AM, Hunter T. The protein kinase family: conserved features and deduced phylogeny of the catalytic domains. Science. 1988;241:42–52. doi: 10.1126/science.3291115. [DOI] [PubMed] [Google Scholar]
- 26.Hansson E. Accumulation of putative amino acid neurotransmitters, monoamines, and d-Ala2-Met-enkephalinamide in primary astroglial cultures from various brain areas, visualized by autoradiography. Brain Res. 1983;289:189–196. doi: 10.1016/0006-8993(83)90019-7. [DOI] [PubMed] [Google Scholar]
- 27.Hawrot E, Patterson PH. Long-term culture of dissociated sympathetic neurons. Methods Enzymol. 1979;58:574–584. doi: 10.1016/s0076-6879(79)58174-9. [DOI] [PubMed] [Google Scholar]
- 28.Haycock JW. Polyvinylpyrrolidone as a blocking agent in immunochemical studies. Anal Biochem. 1993;208:397–399. doi: 10.1006/abio.1993.1068. [DOI] [PubMed] [Google Scholar]
- 29.Hebb DO. The organization of behavior. Wiley; New York: 1949. [Google Scholar]
- 30.Higuchi R. Rapid, efficient DNA extraction for PCR from cells or blood. Amplifications. 1989;2:1–3. [Google Scholar]
- 31.House C, Kemp BE. Protein kinase C contains a pseudosubstrate prototype in its regulatory domain. Science. 1987;238:1726–1728. doi: 10.1126/science.3686012. [DOI] [PubMed] [Google Scholar]
- 32.Hovland P, Flick J, Johnston M, Sclafani RA. Galactose as a gratuitous inducer of GAL gene expression in yeasts growing on glucose. Gene. 1989;83:57–64. doi: 10.1016/0378-1119(89)90403-4. [DOI] [PubMed] [Google Scholar]
- 33.Ivins KJ, Neve KA, Feller DJ, Fidel SA, Neve R. Antisense GAP-43 inhibits the evoked release of dopamine from PC12 cells. J Neurochem. 1993;60:626–633. doi: 10.1111/j.1471-4159.1993.tb03194.x. [DOI] [PubMed] [Google Scholar]
- 34.Jerussi TP, Glick SD. Drug-induced rotation in rats without lesions: behavioral and neurochemical indices of a normal asymmetry in nigro-striatal function. Psychopharmacology. 1976;47:249–260. doi: 10.1007/BF00427609. [DOI] [PubMed] [Google Scholar]
- 35.Kalnins A, Otto K, Ruther U, Muller-Hill B. Sequence of the lacZ gene of Escherichia coli. EMBO J. 1983;2:593–597. doi: 10.1002/j.1460-2075.1983.tb01468.x. [DOI] [PMC free article] [PubMed] [Google Scholar]
- 36.Kano M, Hashimoto K, Chen C, Abelovich A, Aiba A, Kurihara H, Watanabe M, Inoue Y, Tonegawa S. Impaired synapse elimination during cerebellar development in PKCγ mutant mice. Cell. 1995;83:1223–1231. doi: 10.1016/0092-8674(95)90147-7. [DOI] [PubMed] [Google Scholar]
- 37.Kaplitt MG, Kwong AD, Kleopoulos SP, Mobbs CV, Rabkin SD, Pfaff DW. Preproenkephalin promoter yields region-specific and long-term expression in adult brain after direct in vivo gene transfer via a defective herpes simplex viral vector. Proc Natl Acad Sci USA. 1994;91:8979–8983. doi: 10.1073/pnas.91.19.8979. [DOI] [PMC free article] [PubMed] [Google Scholar]
- 38.Kazmarek LK, Levitan IB. Neuromodulation: the biochemical control of neuronal excitability. Oxford UP; New York: 1987. [Google Scholar]
- 39.Kemp BE, Pearson RB. Design and use of peptide substrates for protein kinases. Methods Enzymol. 1991;200:121–134. doi: 10.1016/0076-6879(91)00134-i. [DOI] [PubMed] [Google Scholar]
- 40.Kishimoto A, Mikawa K, Hashimoto K, Yasuda I, Tanaka S, Tominaga M, Kuroda T, Nishizuka Y. Limited proteolysis of protein kinase C subspecies by calcium-dependent neutral protease (calpain). J Biol Chem. 1989;264:4088–4092. [PubMed] [Google Scholar]
- 41.Klawans HL, Hitri A, Carvey PM, Nausieda PA, Weiner WJ. Effect of chronic dopaminergic agonism on striatal membrane dopamine binding. Adv Neurol. 1979;24:77–83. [Google Scholar]
- 42.Knopf JL, Lee MH, Sultzman LA, Kriz RW, Loomis CR, Hewick RM, Bell RM. Cloning and expression of multiple protein kinase C cDNAs. Cell. 1986;46:491–502. doi: 10.1016/0092-8674(86)90874-3. [DOI] [PubMed] [Google Scholar]
- 43.Kow LM, Brown HE, Pfaff DW. Activation of protein kinase C in the hypothalamic ventromedial nucleus or the midbrain central gray facilitates lordosis. Brain Res. 1994;660:241–248. doi: 10.1016/0006-8993(94)91295-5. [DOI] [PubMed] [Google Scholar]
- 44.Lim F, Hartley D, Starr P, Lang P, Song S, Yu L, Wang Y, Geller AI. Generation of high titer defective HSV-1 vectors using an IE-2 deletion mutant and quantitative study of expression in cultured cortical cells. Biotechniques. 1996;20:460–470. doi: 10.2144/19962003460. [DOI] [PubMed] [Google Scholar]
- 45.Maniatis T, Fritsch EF, Sambrook J. Molecular cloning. Cold Spring Harbor Laboratory; Cold Spring Harbor, NY: 1982. [Google Scholar]
- 46.Mao J, Price DD, Mayer DJ, Hayes RL. Pain-related increases in spinal cord membrane-bound protein kinase C following peripheral nerve injury. Brain Res. 1992;588:144–149. doi: 10.1016/0006-8993(92)91354-h. [DOI] [PubMed] [Google Scholar]
- 47.Marshall JF, Ruskin DN, LaHoste GJ. D1/D2 dopamine receptor interactions in basal ganglia. In: Neve KA, Neve RL, editors. The dopamine receptors. Humana; Totowa, NJ: 1997. pp. 193–219. [Google Scholar]
- 48.McGeoch DJ, Dalrymple MA, Davison AJ, Dolan A, Frame MC, McNab D, Perry LJ, Scott JE, Taylor P. The complete DNA sequence of the long unique region in the genome of herpes simplex virus type 1. J Gen Virol. 1988;69:1531–1574. doi: 10.1099/0022-1317-69-7-1531. [DOI] [PubMed] [Google Scholar]
- 49.Muller P, Seeman P. Brain neurotransmitter receptors after long-term haloperidol: dopamine, acetylcholine, serotonin, α-noradrenergic, and naloxone receptors. Life Sci. 1977;21:1751–1758. doi: 10.1016/0024-3205(77)90155-2. [DOI] [PubMed] [Google Scholar]
- 50.Neve KA, Altar CA, Wong CA, Marshall JF. Quantitative analysis of [3H]spiroperidol binding to rat forebrain sections: plasticity of neostriatal dopamine receptors after nigrostriatal injury. Brain Res. 1984;302:9–18. doi: 10.1016/0006-8993(84)91280-0. [DOI] [PubMed] [Google Scholar]
- 51.Nichols RA, Haycock JW, Wang JTK, Greengard P. Phorbol ester enhancement of neurotransmitter release from rat brain synaptosomes. J Neurochem. 1987;48:615–621. doi: 10.1111/j.1471-4159.1987.tb04137.x. [DOI] [PubMed] [Google Scholar]
- 52.Numann R, Catterall WA, Scheuer T. Functional modulation of brain sodium channels by protein kinase C phosphorylation. Science. 1991;254:115–118. doi: 10.1126/science.1656525. [DOI] [PubMed] [Google Scholar]
- 53.Ohno S, Konno Y, Akita Y, Yano A, Suzuki K. A point mutation at the putative ATP-binding site of protein kinase C alpha abolishes the kinase activity and renders it down-regulation-insensitive. A molecular link between autophosphorylation and down-regulation. J Biol Chem. 1990;265:6296–6300. [PubMed] [Google Scholar]
- 54.Patterson T, Everett RD. A prominent serine-rich region in Vmw175, the major transcriptional regulator protein of herpes simplex virus type 1, is not essential for virus growth in tissue culture. J Gen Virol. 1990;71:1775–1783. doi: 10.1099/0022-1317-71-8-1775. [DOI] [PubMed] [Google Scholar]
- 55.Paxinos G, Watson C. The rat brain in stereotaxic coordinates, 2nd Ed. Academic; New York: 1986. [Google Scholar]
- 56.Pearson RB, Kemp BE. Protein kinase phosphorylation site sequences and consensus specificity motifs: tabulations. Methods Enzymol. 1991;200:62–81. doi: 10.1016/0076-6879(91)00127-i. [DOI] [PubMed] [Google Scholar]
- 57.Poirier LJ, Giguere M, Marchand R. Comparative morphology of the substantia nigra and ventral tegmental area in the monkey, cat, and rat. Brain Res Bull. 1983;11:371–397. doi: 10.1016/0361-9230(83)90173-9. [DOI] [PubMed] [Google Scholar]
- 58.Pozzan T, Gatti G, Dozio N, Vicentini LM, Meldolesi J. Ca2+-dependent and -independent release of neurotransmitters from PC12 cells: a role for protein kinase C activation? J Cell Biol. 1984;99:628–638. doi: 10.1083/jcb.99.2.628. [DOI] [PMC free article] [PubMed] [Google Scholar]
- 59.Prickett KS, Amberg DC, Hopp TP. A calcium-dependent antibody for identification and purification of recombinant proteins. Biotechniques. 1989;7:580–589. [PubMed] [Google Scholar]
- 60.Riedel H, Hansen H, Parissenti AM, Su L, Shieh H, Zhu J. Phorbol ester activation of functional rat protein kinase C β-1 causes phenotype in yeast. J Cell Biochem. 1993;52:320–329. doi: 10.1002/jcb.240520308. [DOI] [PubMed] [Google Scholar]
- 61.Roskoski R. Assays of protein kinase. Methods Enzymol. 1983;99:3–6. doi: 10.1016/0076-6879(83)99034-1. [DOI] [PubMed] [Google Scholar]
- 62.Sacktor TC, Osten P, Valsamis H, Jiang X, Naik MU, Sublette E. Persistent activation of the ζ isoform of protein kinase C in the maintenance of long-term potentiation. Proc Natl Acad Sci USA. 1993;90:8342–8346. doi: 10.1073/pnas.90.18.8342. [DOI] [PMC free article] [PubMed] [Google Scholar]
- 63.Sommer SS, Sarkar G, Koeberl DD, Bottema CDK, Buerstedde JM, Schowalter DB, Cassaday JD. Direct sequencing with the aid of phage promoters. In: Innis MA, Gelfand GA, Sninsky JJ, White TJ, editors. PCR protocols. Academic; San Diego, CA: 1990. pp. 197–205. [Google Scholar]
- 64.Song S, Wang Y, Bak SY, Lang P, Ullrey D, Neve RL, O’Malley KL, Geller AI. A HSV-1 vector containing the rat tyrosine hydrox- ylase promoter enhances both long-term and cell type-specific expression in the midbrain. J Neurochem. 1997;68:1792–1803. doi: 10.1046/j.1471-4159.1997.68051792.x. [DOI] [PubMed] [Google Scholar]
- 65.Stumpo DJ, Graff JM, Albert KA, Greengard P, Blackshear PJ. Molecular cloning, characterization, and expression of a cDNA encoding the “80 to 87 kDa” myristoylated alanine-rich C kinase substrate: a major cellular substrate for PKC. Proc Natl Acad Sci USA. 1989;86:4012–4016. doi: 10.1073/pnas.86.11.4012. [DOI] [PMC free article] [PubMed] [Google Scholar]
- 66.Tanaka C, Nishizuka Y. The protein kinase C family for neuronal signaling. Annu Rev Neurosci. 1994;17:551–567. doi: 10.1146/annurev.ne.17.030194.003003. [DOI] [PubMed] [Google Scholar]
- 67.Ungerstedt U. Postsynaptic supersensitivity after 6-hydroxy-dopamine-induced degeneration of the nigro-striatal dopamine system. Acta Physiol Scand Suppl. 1971;367:69–93. doi: 10.1111/j.1365-201x.1971.tb11000.x. [DOI] [PubMed] [Google Scholar]
- 68.Ungerstedt U, Arbuthnott GW. Quantitative recording of rotational behavior in rats after 6-hydroxy-dopamine lesions of the nigrostriatal dopamine system. Brain Res. 1970;24:485–493. doi: 10.1016/0006-8993(70)90187-3. [DOI] [PubMed] [Google Scholar]
- 69.Wakade AR, Wakade TD. Comparison of transmitter release properties of embryonic sympathetic neurons growing in vivo and in vitro. Neuroscience. 1988;27:1007–1019. doi: 10.1016/0306-4522(88)90205-9. [DOI] [PubMed] [Google Scholar]
- 70.Wilner KD, Butler IJ, Seifert WE, Clement-Cormier YC. Biochemical alterations of dopamine receptor responses following chronic l-DOPA therapy. Biochem Pharmacol. 1980;29:701–706. doi: 10.1016/0006-2952(80)90543-2. [DOI] [PubMed] [Google Scholar]
- 71.Wood MJA, Byrnes AP, Pfaff DW, Rabkin SD, Charlton HM. Inflammatory effects of gene transfer into CNS with defective HSV-1 vectors. Gene Ther. 1994;1:283–291. [PubMed] [Google Scholar]
- 72.Yamamoto BK, Lane RF, Freed CR. Normal rats trained to circle show asymmetric caudate dopamine release. Life Sci. 1982;30:2155–2162. doi: 10.1016/0024-3205(82)90289-2. [DOI] [PubMed] [Google Scholar]