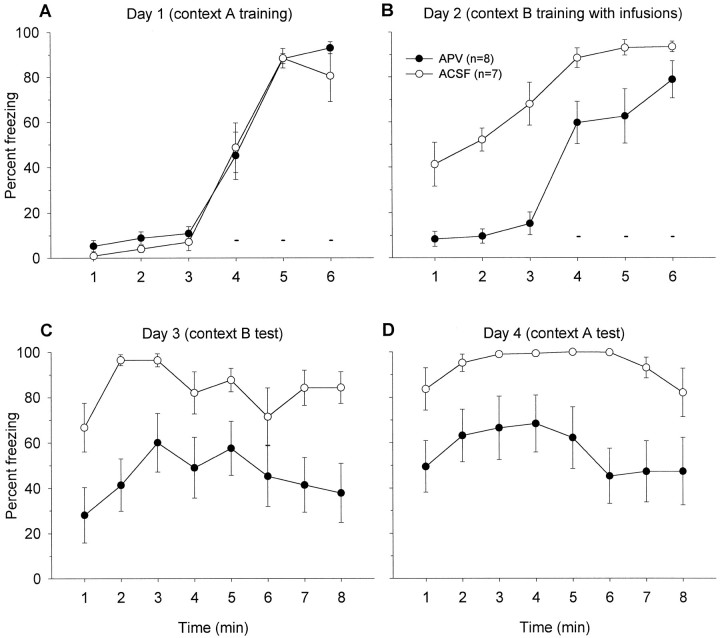
Fig. 4.
A, Mean percentage of freezing (± SEM) 3 min before and during the ITIs amid three footshocks (small bars) in context A (no infusions). Solid circles are to-be-APV, and open circles are to-be-ACSF groups on day 2. B, Mean percentage of freezing (± SEM) demonstrated by ACSF- and APV-treated rats 3 min before and during the ITIs between three shocks (small bars) in context B. C, Mean percentage of freezing (± SEM) during 8 min in context B. D, Mean percentage of freezing (± SEM) during 8 min in context A.

