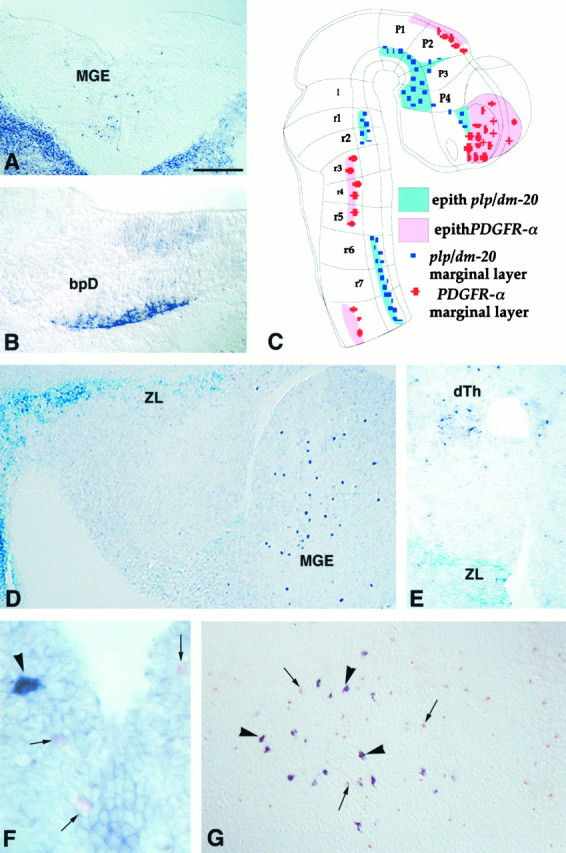
Fig. 5.

In the developing embryonic mouse brain,PDGFRα and plp/dm-20 are expressed in distinct cell populations. Cryosections of wild-type mouse embryo at E10.5 (A, B), E14.5 (F), and E17.5 (G), or E12.5 plp-sh ble-lacZembryos (D, E) were treated for ISH with eitherPDGFRα (A, D–G) orplp-dm-20 DIG- (B) or fluorescein-labeled (F, G) antisense cRNA probes.A, B, On coronal sections,PDGFRα+ cells are seen in the medial ganglionic eminence (A), whereasplp-dm-20+ cells are detected in the laterobasal plate of the diencephalon (bpD) (B). In A, the strong staining in the bottom right and left cornersillustrates the expression of PDGFRα in non-neural tissues. C, Drawing of an E10.5 mouse CNS embryo showing the distribution of PDGFRα+ andplp-dm-20+ cells. D, E, Sagittal (D) and coronal (E) sections of an E12.5 transgenic embryo treated for histoenzymatic detection of β-gal activity (X-gal,light blue) and ISH with a PDGFRα cRNA (dark purple) showing expression of the transgene in the zona limitans (ZL) (p2–p3 interprosomeric boundary) (D, E) and the caudal hypothalamus (D), whereasPDGFRα+ cells are seen in the medial ganglionic eminence (MGE in D) and the dorsal thalamus (dTh in E). F, G, Coronal section at the level of the rhombic lip (F) and sagittal section at the level of the medulla (G), labeled by double ISH showing that the PDGFRα+ cells (small arrows, pink or orange staining) and plp-dm-20+ cells (arrow heads, dark purple) are distinct populations. Scale bar (shown in A): A, 180 μm; B, 190 μm; D, 200 μm; E, 150 μm;F, 30 μm; G, 120 μm.
