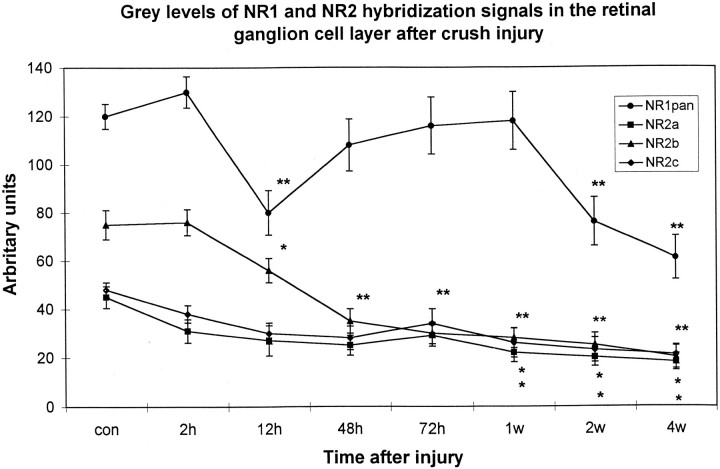
Fig. 1.
Time course of NR1 pan and NR2 subunit expression after crush injury depicted as median gray levels. Silver grain density was assessed with a computer-based video image analysis system, with gray levels ranging from black (0) to white (255). Because this scale is counterintuitive, the values were inverted. Thus, an increase in grain density is reflected by a positive percentage of deviation from baseline values, whereas a decrease is followed by a negative percentage of deviation. Each value represents the mean ± SE of three measures from three to four retinas per time point for each probe. *p < 0.05; **p< 0.01.

