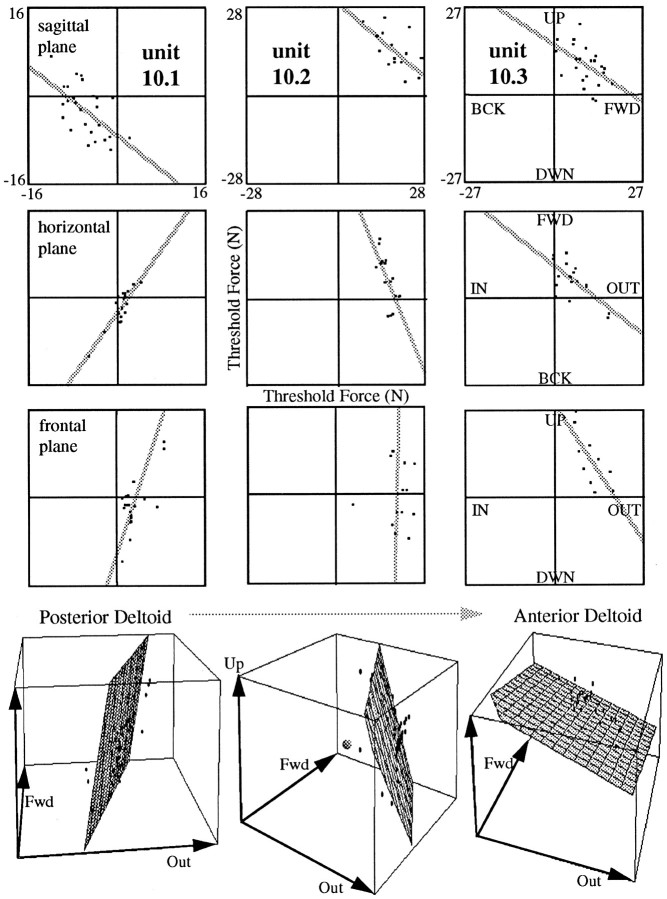
Fig. 10.
Threshold lines and planes for deltoid units 1 (most posterior) to 3 (most anterior). The top three rows show the threshold lines in each plane derived from trials with force ramps within the respective plane. For the plots in thebottom row, data from all trials were combined in 3D and fit by a plane. The origin of the plot is located at the center of the cube and is marked by the small sphere in the plot for unit 2. The equations for the plane fits are as follows: unit 1,z = −2196.3 + 7.4x − 2.8y; unit 2, z = 7628.3 − 3.4x − 1.9y; unit 3,z = 1245.6 − 0.4x− 0.3y, where x, y, andz have positive values for outward, forward, and upward, respectively. As location of the units changes from posterior to anterior, the best direction appears to “jump” from down–backward to up–forward in the sagittal plane; in the horizontal and frontal planes, however, it appears to gradually rotate counterclockwise from out–back to out–forward and from out–down to out–up. All data are from subject A.

