Fig. 1.
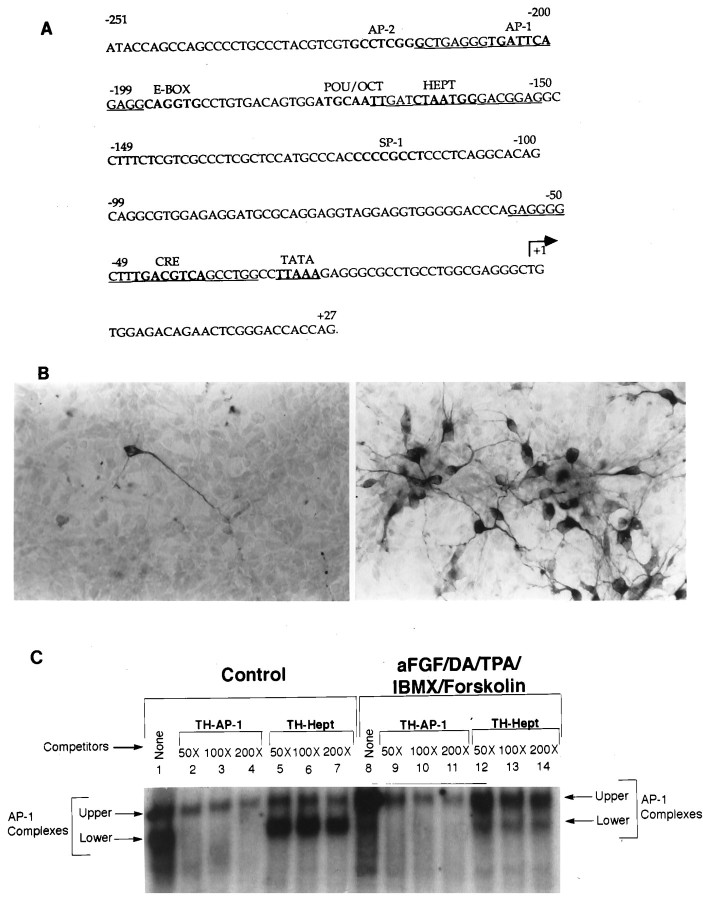
Induction of distinct TH–AP-1 binding protein complexes in E14 striatal neurons after treatment with aFGF and its coactivators. A, Nucleotide sequence of the rat TH gene promoter. The cis-acting DNA sequences for various transcription factors (AP-1, AP-2, E-Box, etc.) are printed inbold. The TATA box is represented in boldand is underlined. The transcription start site is indicated by the arrow. The TH-specific AP-1 and Hept oligonucleotides used in the gel shift and supershift assays are indicated by underlining. Note that the rat TH sequences are derived from Cambi et al. (1989). B, Immunocytochemical localization of TH in cultured striatal neurons stimulated by aFGF and its coactivators. Neurons were established in culture as described previously (Iacovitti et al., 1989, 1991) 1 d before incubation in control media (left panel) or in media supplemented with 10 ng/ml aFGF, 200 nm TPA, 20 μm DA, 0.25 mm IBMX, and 50 μmforskolin (right panel). The next day the cultures were fixed, and TH was localized immunocytochemically. Note that aFGF plus the coactivators produced a striking induction of TH in many cultured striatal neurons. C, Autoradiogram of a representative gel shift of TH–AP-1 binding in rat E14 striatal neurons fed DM (Control) or DM containing aFGF and the coactivators. An end-labeled TH–AP-1 oligonucleotide duplex from −214 to −196 bp of the TH promoter sequences was incubated with 3 μg of nuclear extracts from rat E14 striatal neurons treated with aFGF, DA, TPA, IBMX, and forskolin (concentrations as above) or with control media only. The protein–DNA complexes were resolved on a 4% native polyacrylamide gel, as described in Materials and Methods. There were two bands of AP-1 binding complexes present in both control and induced striatal neurons (lanes 1, 8). The lower band was found predominantly in control cultures (lane 1), whereas the upper band was the primary band in stimulated cultures (lane 8). Oligonucleotide competition assays (lanes 2–7, 9–14) were performed with unlabeled double-stranded oligonucleotides corresponding to TH–AP-1 and TH–Hept (−170 to −152 bp, as shown in A). The lower bands were easily competed by specific TH–AP-1 oligonucleotides, but not by nonspecific TH–Hept oligonucleotides. The bands decreased in intensity with the addition of increasing amounts (50-, 100-, and 200-fold excess) of specific TH–AP-1 oligonucleotides, whereas their intensity remained the same with the addition of excess nonspecific TH–Hept oligonucleotides.

