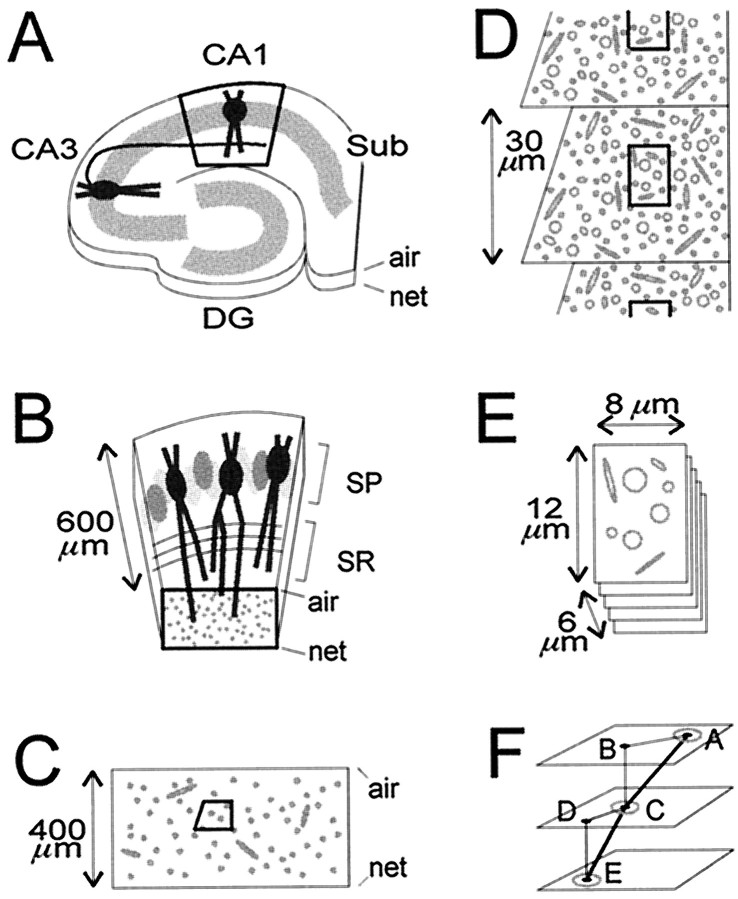
Fig. 1.
Location, orientation, and sectioning of CA1 stratum radiatum samples. The air and netsurfaces are labeled. A, A hippocampal slice, depicting the Schaffer collateral of a CA3 pyramidal neuron projecting to the apical dendrites of a pyramidal neuron in CA1 stratum radiatum. After fixation, the slice was trimmed initially to leave just the central part of area CA1 (bold outline). DG, Dentate gyrus; Sub, subiculum. B, Higher power view of the trimmed area of CA1, showing pyramidal neurons in stratum pyramidale (SP) and their apical dendrites, which are cross-sectioned in the middle third of stratum radiatum (bold outline). C, Thick and thin sections of the block face, spanning the entire thickness of the slice, were examined to ascertain excellent tissue preservation and to determine the optimal level for taking serial thin sections. Then a right-angled trapezoid (bold outline) for serial thin sectioning was created at that level by trimming away surrounding tissue. D, On each serial thin section, micrographs were taken of the same region (bold outline).E, The resulting stack of serial micrographs totaled 107–109 images, with the dimensions indicated. F, The triangulation method used to measure lengths of axons. Thepoints at which the axons exited the stack of images, labeled A and E, and crossed the middle, labeled C, were marked. On overlays, the distances in the x–y plane between the exit points and the middle point were measured (line segments AB andCD). The z-axis differences between the points (line segments BC and DE) were calculated from the measured average section thickness and the number of intervening sections. The sum of the calculated hypotenuses (line segments AC and CE) gave the total length of the axon segment.

