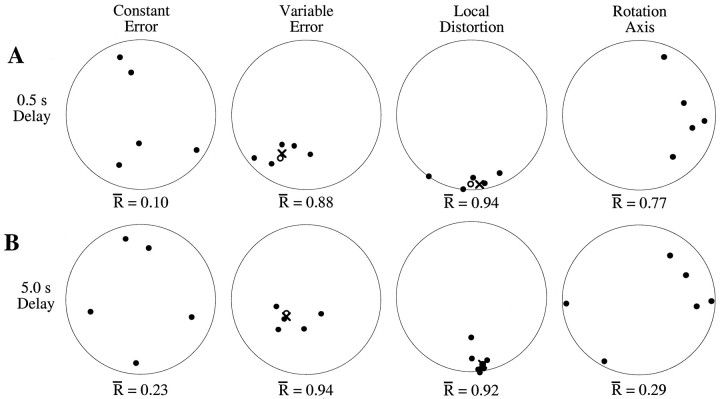
Fig. 2.
Intersubject variability and the computation of ensemble averages. Each panel represents an equal-area projection of direction vectors into the horizontal plane, for trials to the mid-target region in the dark–short (A) and dark–long (B) conditions. Each filled circle represents the average response for a single subject for (1) the constant error, (2) variable error (first eigenvector indicating the direction of maximum variability), (3) local distortion (third eigenvector indicating the axis of maximum contraction), and (4) rotation axis within the local transformation. Points near the center of each panel represent upward pointing vectors, whereas points near the edge of the bounding circle indicate forward, backward, leftward, or rightward directions for the top, bottom, left, and right edges, respectively. Direction vectors are clustered for the variable error and local distortion vectors but not for the constant error directions or rotation axes. Open circles indicate the average of the individual direction vectors for the distributions showing significant clustering. The symbol X indicates the direction vector computed from the corresponding ensemble covariance or local transformation matrix.

