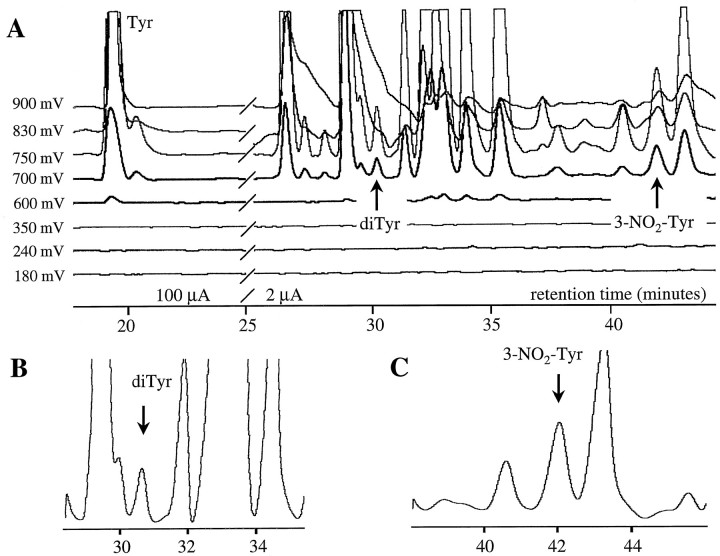
Fig. 1.
HPLC-ECD chromatogram of a protein digest from an AD brain (SMTG region) illustrating the resolution of peaks assigned to tyrosine (Tyr), 3,3′ dityrosine (diTyr), and 3-nitrotyrosine (3-NO2-Tyr;A). B, C, Expansion of chromatogram in A to illustrate the resolution of dityrosine and nitrotyrosine peaks.

