
Fig. 6.
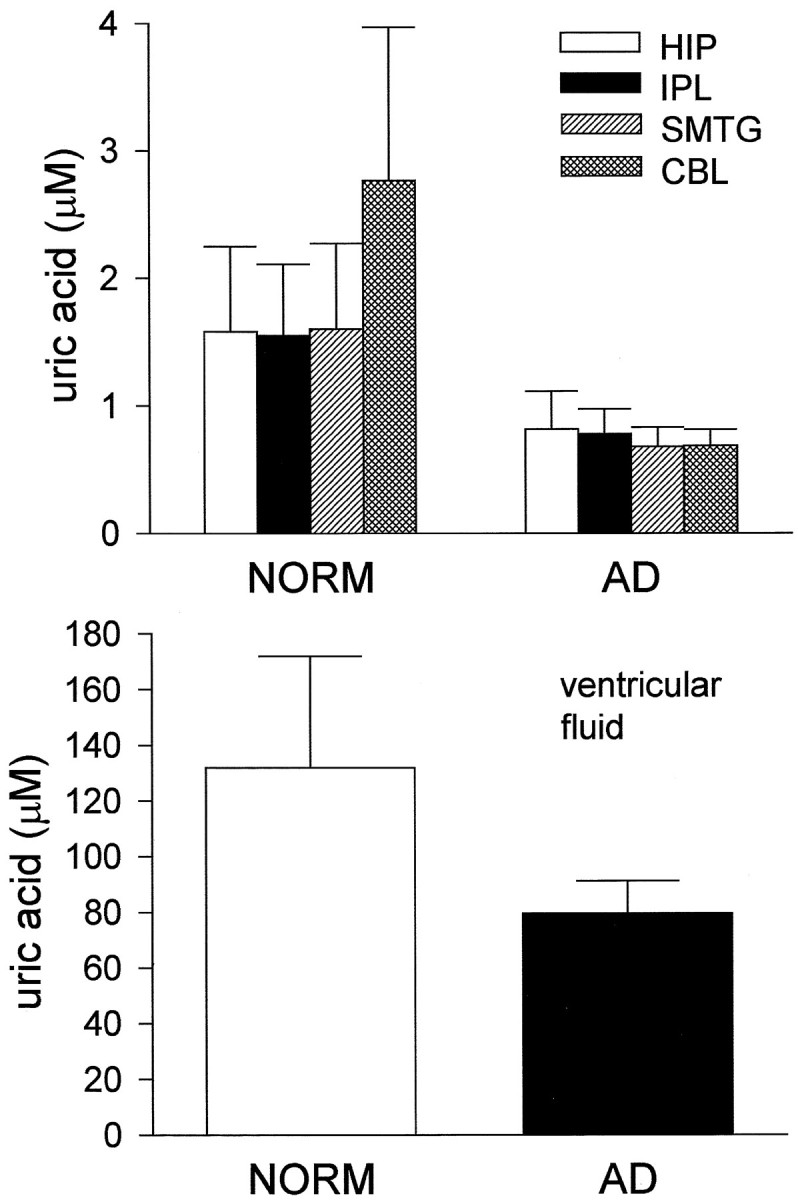
Uric acid content of VF and brain tissue from normal and AD subjects. Error bars indicate SEM. Uric acid concentration was depressed significantly in AD brain (p < 0.05 by ANOVA).
Official websites use .gov
A
.gov website belongs to an official
government organization in the United States.
Secure .gov websites use HTTPS
A lock (
) or https:// means you've safely
connected to the .gov website. Share sensitive
information only on official, secure websites.
Uric acid content of VF and brain tissue from normal and AD subjects. Error bars indicate SEM. Uric acid concentration was depressed significantly in AD brain (p < 0.05 by ANOVA).