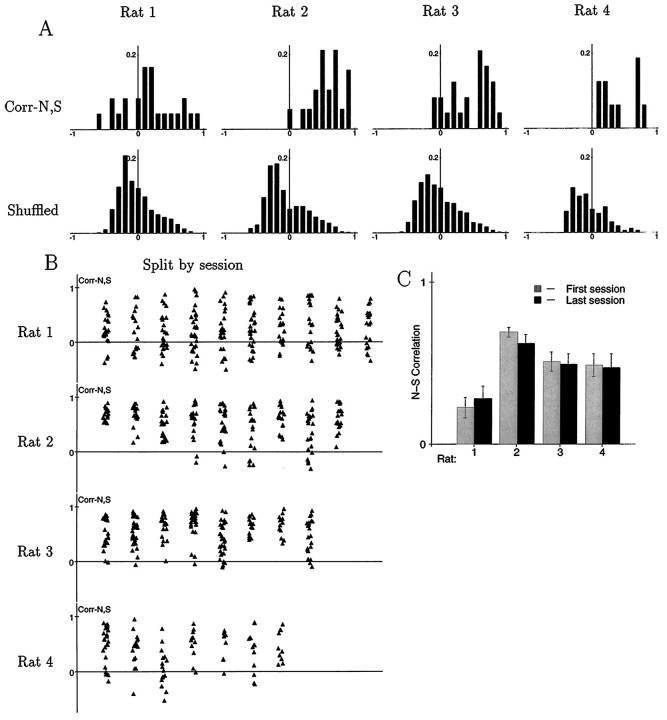
Fig. 4.
Relations between firing fields in the N and S boxes. A, For each rat, the top plot shows the distribution of N–S correlations across all cells recorded during a single session on one of the later days. As a control, the distribution obtained by taking N and S firing rate maps from different, randomly chosen cells is shown below, reflecting the distribution that would be expected if the N and S firing fields of a cell were unrelated. For each rat, the observed distribution of N–S correlations differed significantly from the mixed-cell control (p < 0.005; Kolmogorov–Smirnov test). B, Distribution of N–S correlations for the first recording session of every day, from each of the four rats. Each point shows the N–S correlation of one cell, and each vertical streak shows values from one session. The horizontal coordinates are randomized slightly to make the points easier to distinguish. For rat 1, the distributions from different sessions were statistically indistinguishable. For rats 2, 3, and 4, in contrast, there was significant variability across sessions, as shown by ANOVAs (p < 0.01 for each; F test).C, Mean levels of N–S correlation for the first and last available recording sessions for each rat. For rats 1, 2, and 4, the first session came from day 1 in the apparatus; for rat 3, it came from day 5. The last session for each rat was session 1 of the day of the probe session. There was no apparent tendency for the level of N–S correlation to increase or decrease as a function of experience.

