Fig. 5.
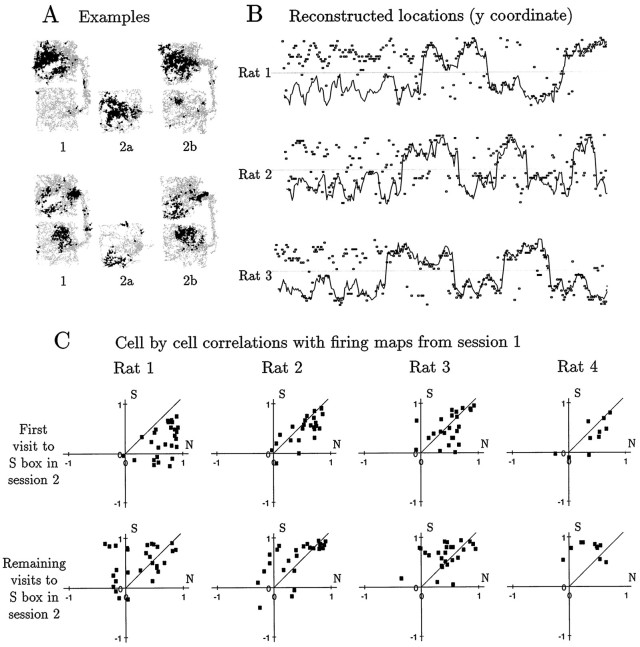
Evidence for map shifting during the probe session. A, Two examples of the behavior of individual cells from rat 1. For each cell, spatial firing plots are shown for sessions 1, 2a, and 2b. In both cases (and this was typical), the plot for session 2a resembles the N portion of the plot for session 1 much better than the S portion, whereas the plot for session 2b closely matches the plot for session 1. B, Trajectory reconstructions for the first 5 min of the probe session, for rats 1, 2, and 3. In each plot, the horizontal coordinate represents time, and the vertical coordinate represents the Y coordinate of the rat’s position, with the light gray line at the level of the wall between the two boxes. The solid line represents the rat’s actual position, and the small rectangles represent positions reconstructed from 1 sec samples of population activity, using firing rate maps from the previous session as the basis for reconstruction. For rats 1 and 3, the reconstructed locations during the initial stay in the S box fell mostly into the N box, but as soon as the rat passed through the corridor, the reconstructions reverted to mostly match the rat’s actual position. For rat 2, the reconstructions were at all times distributed almost evenly between the N and S boxes, regardless of the rat’s actual position. Trajectory reconstruction was not performed for rat 4 because of the small number of cells available.C, Correlation plots of firing rate maps derived from the S2a and S2b subsessions with maps for the same cells from the N and S boxes in session 1. Each point represents one cell. The horizontal coordinate is the correlation of the cell’s N1 firing rate map with the S2a map (top panel) or S2b map (bottom panel). The vertical coordinate is the correlation of the S1 map with the S2a map or S2b map. Thus, points lying below the diagonal indicate greater resemblance to N1 than to S1. For all four rats, the majority of points in the top plots lie below the diagonal, indicating that the population representation during S2a aligned better with N1 than with S1; however, the difference was statistically significant only for rat 1 (p < 0.00001;t test). Again for all four rats, the majority of points in the bottom plots lie above the diagonal, indicating that the population representation during S2b aligned better with S1 than with N1 (p < 0.01 for each; t test).

