
Fig. 7.
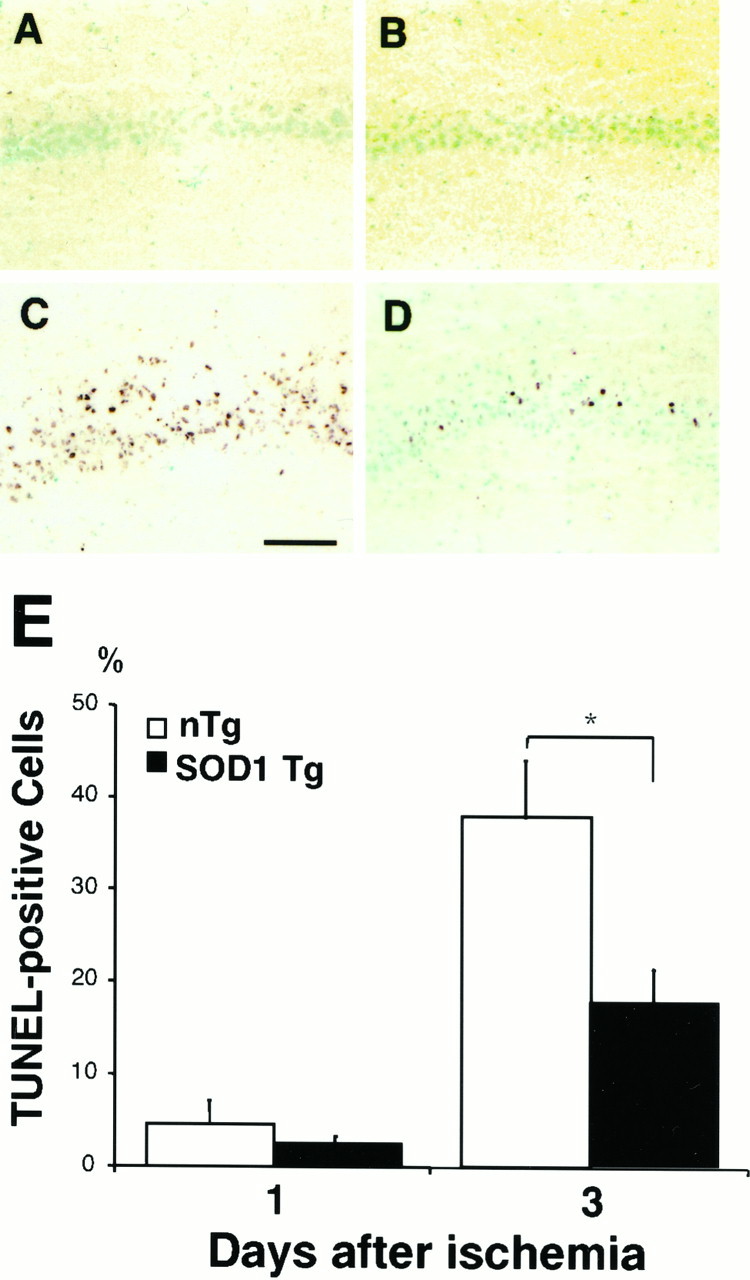
DNA fragmentation. Representative photographs showing DNA fragmentation by TUNEL staining at 1 d (A, B) and 3 d (C, D) after 10 min of global ischemia and reperfusion. The DNA-fragmented cells labeled by TUNEL staining were restricted to the hippocampal CA1 subregion at 3 d after global ischemia, but not at 1 d after global ischemia. A marked number of TUNEL-positive cells was observed in the CA1 subregion in non-Tg littermates (C), compared with SOD1 Tg rats (D). Scale bar, 500 μm. Quantitative analysis showed the ratio of TUNEL-positive neurons in the hippocampal CA1 subregion after global ischemia and reperfusion. The ratio was significantly ameliorated in Tg rats (closed bar) compared with non-Tg littermates (open bar) at 3 d (n = 6; p < 0.03). However, the ratio was the same between Tg and non-Tg rats at 1 d (n = 4). Values are mean ± SE (Fisher’s protected least significant difference test followed by nonparametrict test). E, Quantitative analysis of TUNEL-positive cells in the hippocampal CA1 subregion in SOD1 Tg rats and non-Tg littermates after transient global cerebral ischemia. TUNEL-positive cells in the hippocampal CA1subregion were counted by imaging analysis. There was a significant reduction in these DNA-fragmented cells in SOD1 Tg rats as compared with non-Tg littermates at 3 d after 10 min of ischemia. *p < 0.03, Fisher’s protected least significant difference test followed by nonparametric t test.