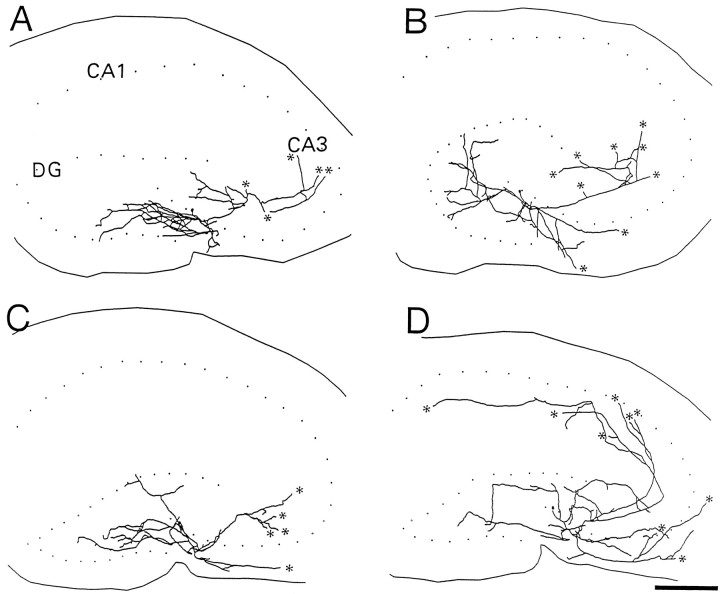
Fig. 8.
Comparison of recurrent axon arbors emanating from CA3C pyramidal cells in control and experimental rats.A and B show computer-reconstructed axon arbors from two control rats. C and D are from two experimental rats. Dotted lines depict the pyramidal and granule cell layers. The solid linesoutline the natural surface of the slices. Asterisksdenote artificial cut ends of Schaffer collaterals on the surface of slices. The general pattern of axonal arborization appears similar in samples from control and experimental rats. Scale bar, 500 μm.

