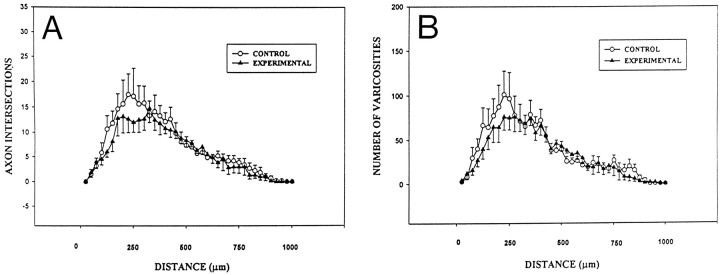
Fig. 9.
Sholl analysis of axon arbors and numbers of varicosities in control and experimental rats. A, Graph compares the mean number of axon intersections of concentric rings that were centered on the soma and spaced at 25 μm intervals. There appears to be a tendency for slightly fewer axon crossings 200–300 μm from the soma in neurons from experimental rats. B, Graph of the mean number of varicosities located within the concentric rings. Like results from axon intersections, slightly fewer varicosities were seen in experimental rats within 250 μm of the soma. Data expressed as ± SEM. A repeated measures two-way ANOVA was used to compare axon arbors from experimental and control rats. Measures of axons and varicosities from experimental rats were found not to be statistically different from those of the control group (p > 0.05).

