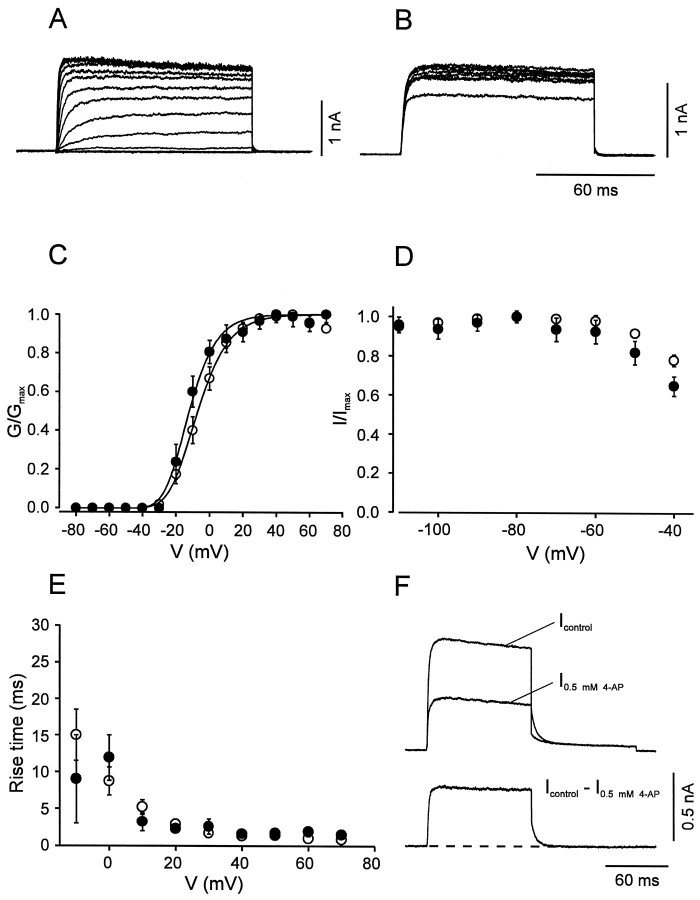
Fig. 4.
Activation and inactivation of the fast delayed rectifier K+ current component. A,B, Traces of K+ current obtained by subtraction (Icontrol −I0.5 mm 4-AP) in BC patches. InA, the test pulse potential was varied from −80 to 70 mV (10 mV increment), and the holding potential was −90 mV. InB, the potential of the prepulse (10 sec) was varied from −110 to −40 mV, and the test pulse potential was kept constant at 20 mV. C, Activation curves for BC patches (open circles, n = 14) and PC patches (filled circles, n = 9). Data points were fitted with Boltzmann functions raised to the fourth power. Pulse program as described in A.D, Steady-state inactivation curves for BC patches (open circles, n = 6) and PC patches (filled circles, n = 5). Pulse program as described in B. E, 20–80% rise time, plotted against test pulse voltage for BC patches (open circles, n = 14) and PC patches (filled circles, n = 9). Data in C–E were obtained by subtraction of either Icontrol −I0.5 mm 4-AP orIcontrol − I1 mm TEA. Because the two approaches gave similar results, data were pooled. F, Deactivation time course at −40 mV in a BC patch. Pulse program: holding potential −90 mV, 100 msec pulse to 20 mV, 100 msec pulse to −40 mV, and step back to −90 mV. Top traces were obtained in the absence and presence of 0.5 mm 4-AP, bottom trace represents subtracted current. Note the fast deactivation of the 4-AP-sensitive component (decay τ 4.9 msec for the trace shown). For curve parameters, see Table 1.

