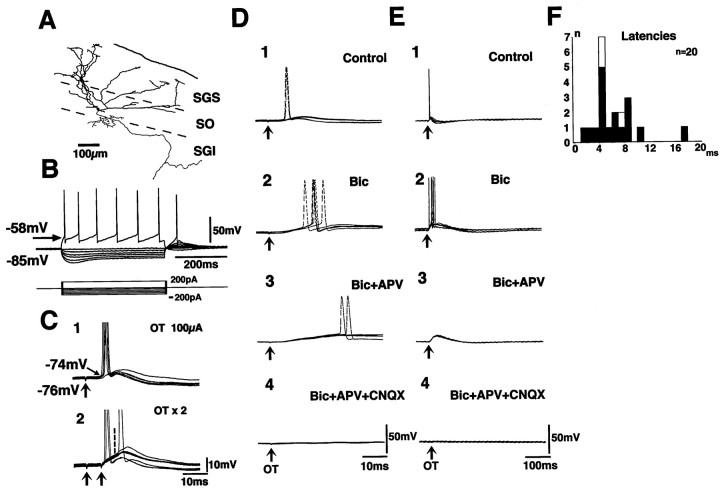
Fig. 3.
Synaptic potentials induced by the OT stimulation in an SO neuron. The morphology of the recorded neuron, stained with biocytin, is illustrated in A. Dendrites are drawn asthick lines. The axon and its collaterals are drawn asthin lines. B shows the voltage responses of this neuron to various current pulses. Here, the threshold of the action potentials was approximately −58 mV. Synaptic potential induced by the OT stimulation is shown in C1. Action potentials were induced from the membrane potential of −74 mV, overriding the EPSPs. C2 shows synaptic responses to double stimulus of the OT at an interval of 4 msec. The onset of the EPSP induced by the second stimulus is indicated by a vertical broken line. Effects of 10 μm Bic and additional application of 50 μm APV and 10 μm CNQX are shown inD1–4 (faster time sweeps) and E1–4(slower time sweeps). F shows distribution of latencies of the EPSPs induced by the OT stimulation in SO neurons. Closed columns indicate the cases of wide-field vertical cells, andopen columns indicate the other cell types.

