
Fig. 1.
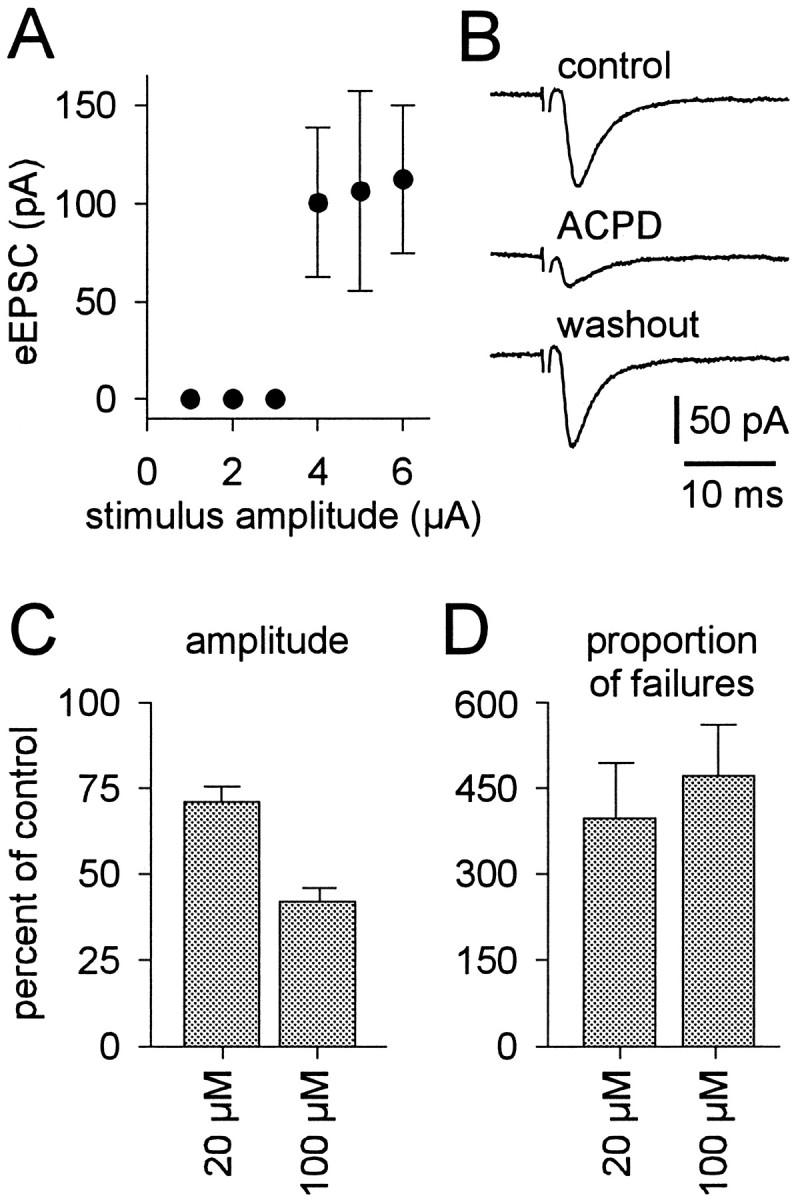
The effects of (1S,3R)-ACPD on unitary evoked synaptic transmission. A, A plot of the relationship between evoked EPSC amplitude (mean ± SD) and stimulus intensity.B, Evoked EPSCs from the cell in A during control (top), 100 μm (1S,3R)-ACPD (middle), and washout (bottom) conditions. Trigeminal motoneurons were recorded with patch solution containing intracellular Cs+ in the presence of bicuculline and strychnine. Holding potential was −60 mV; time and current calibrations are shown. The stimulus artifact is partially deleted. C, D, A summary of the effects of 20 and 100 μm (1S,3R)-ACPD on evoked EPSC amplitude (C) and proportion of synaptic failures relative to control (D). Both ordinate axes reflect percentage of control; bars reflect the mean of all cells tested (± SE).