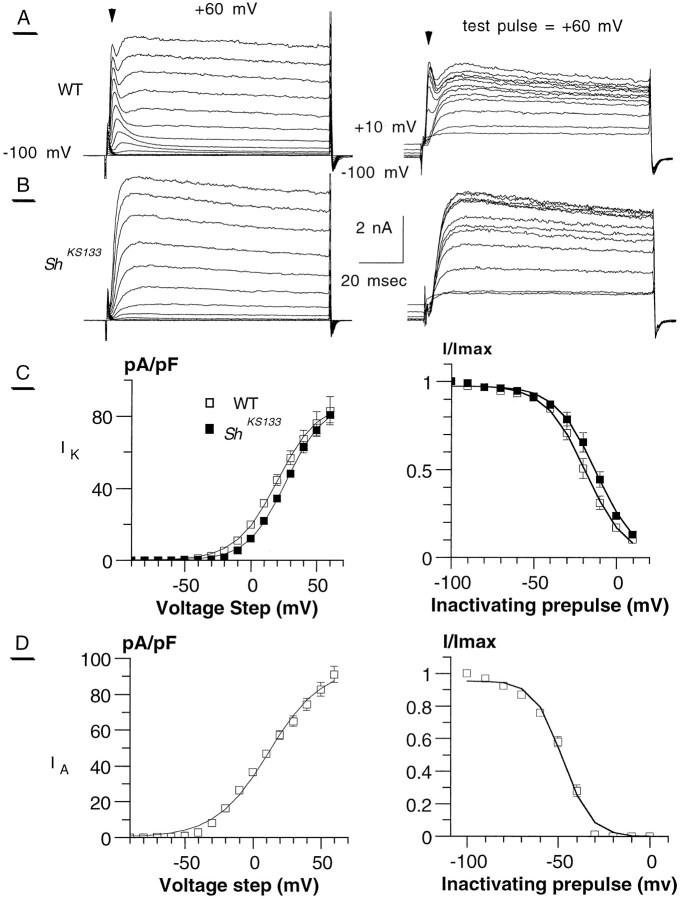
Fig. 1.
Activation and inactivation characteristics ofIA and IK inDrosophila photoreceptors. A, Representative wild-type (WT) whole-cell recordings of photoreceptor potassium currents using the activation (left) and inactivation (right) protocols. Usually, we can clearly differentiate the inactivatingIA component (arrowheads) separated from the slowly inactivating IK.B, Representative whole-cell recordings of activation (left) and inactivation (right) protocols of the Shaker mutant alleleShKS133. C(left), The current density (pA/pF) is plotted against the voltage steps for WT (■) andShKS133 (▪). TheIK component is characterized (Boltzmann fitting, assuming a reversal potentialVK = −85 mV) byImax = 85.5 ± 4.1 pA/pF and 87.8 ± 5.6 pA/pF for WT (n = 11) andShKS133 (n = 8), respectively. Right, Steady-state inactivation ofIK in WT (■) andShKS133 (▪). For Boltzmann fitting parameters, see Table 2. D (left), The current density/voltage curve of IA is presented (Table 1). IA is characterized (Boltzmann fitting, measured at peak outward current, assuming a reversal potential VK = −85 mV) byImax = 92.3 ± 7.8 pA/pF (n = 11). Right, The Boltzmann fitting of IA steady-state inactivation gave the values V50 = −42.1 ± 1.0 mV and slope = 10.0 ± 0.8 (n = 4). In all voltage-clamp experiments throughout this study, the holding potential was −100 mV. For the activation protocol, cells were stepped from −100 mV to +60 mV in 10 mV increments, during a 100 msec test pulse (left column). In the steady-state inactivation protocol, the cell membrane was subjected to inactivating prepulses of 1 sec duration from −90 mV to +10 mV in 10 mV increments, before 80 msec test pulse to +30 mV (right column).

