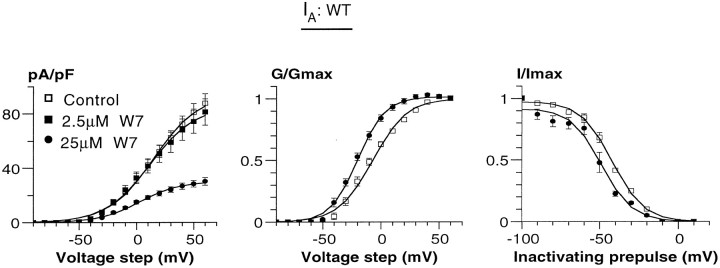
Fig. 3.
The effect of W7 on IA. The current density/voltage curve (left), their normalized conductance (middle), and the corresponding steady-state inactivation curves (right) are shown for control (■), 2.5 μm W7 (▪), and 25 μmW7 (•) data. Because little effect on IAwas observed in the presence of 2.5 μm W7, only the data obtained with 25 μm W7 were included in the normalized conductance and steady-state inactivation curves. All of the curves were fitted by Boltzmann distributions. For details of the fitting values, see Tables 1 and 2.

