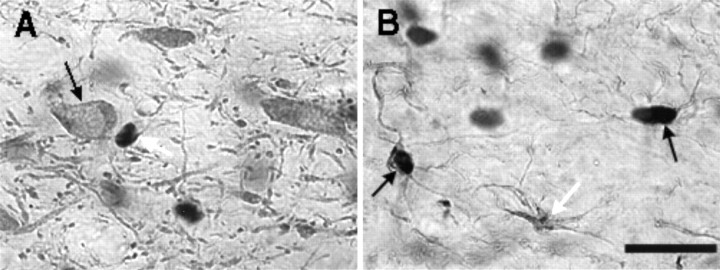
Fig. 6.
Digitized images of VTA sections from an animal treated with amphetamine as in experiment 1 and killed 1 week after the last injection. The large black blobs indicate bFGF immunoreactivity. A, Section labeled with both TH and bFGF. bFGF-IR (indicated by the white arrow) was not found within the large TH-positive cells (see black arrow). B, Section labeled with both GFAP and bFGF. Arrows point to three GFAP-IR astrocytes. Thewhite arrow points to an astrocyte that was not labeled for bFGF. The black arrows point to two astrocytes that were labeled with both bFGF and GFAP. (Oil immersion: Scale bar, 25 μm).

