
Fig. 2.
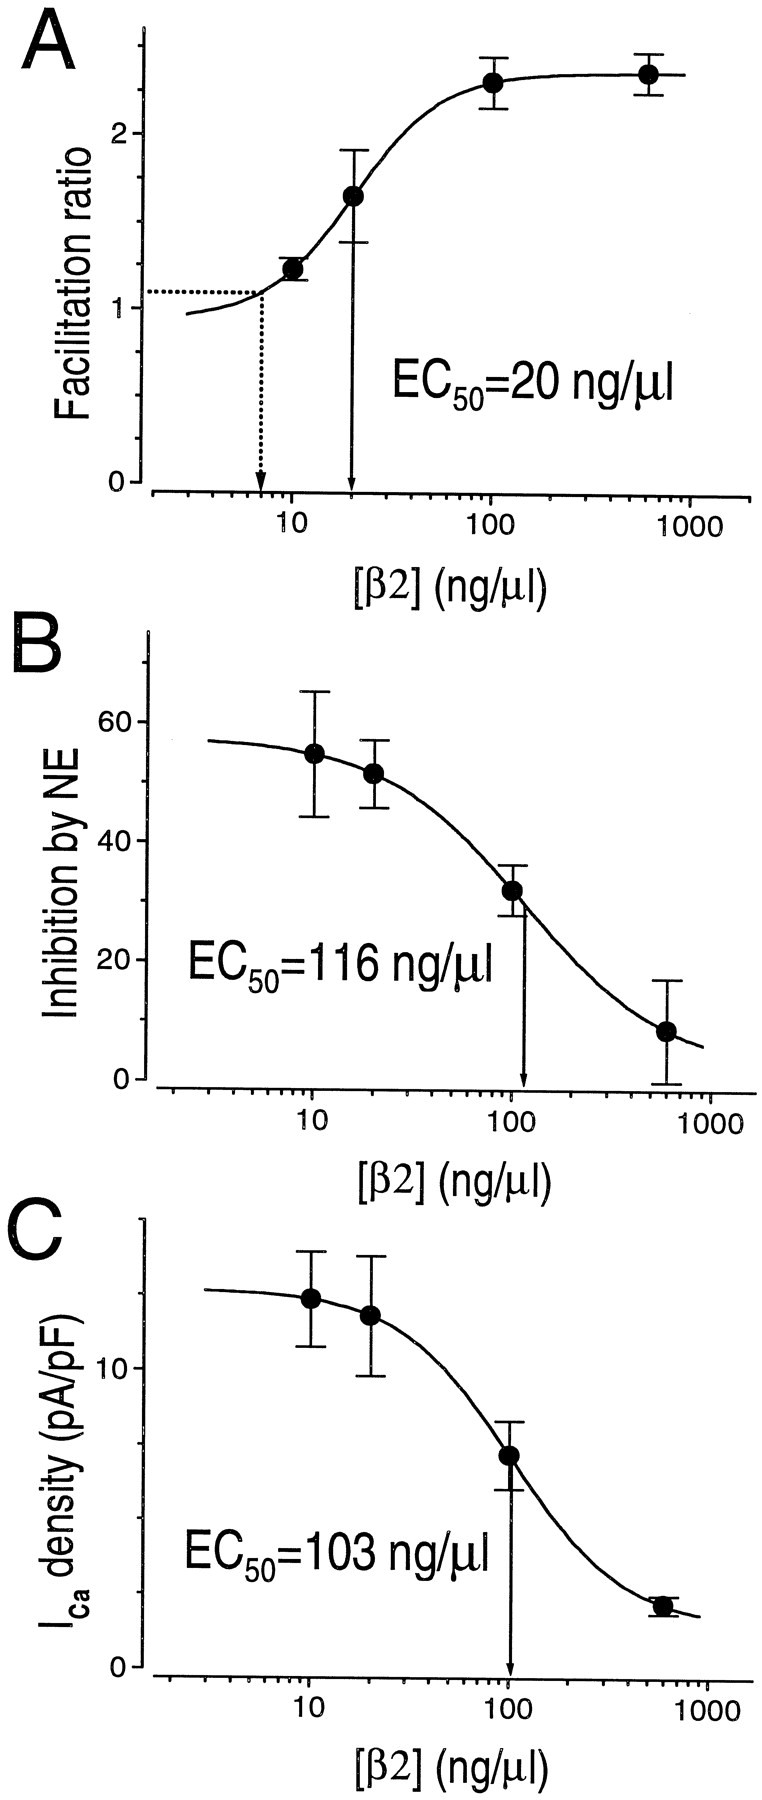
Concentration–response relationships for facilitation ratio, inhibition by NE, and ICa density. Gβ2 DNA concentrations ([β2]) are plotted on a logarithmic scale. Data were fitted to a Hill function, y = [(A1-A2)/{1+([β2]/[β2]0)n}] + A2, with best fitting values of the midpoints, [β2]0 = 20.0, 156, and 103 ng/μl (vertical solid line); Hill coefficients,n = 2.0, 1.2, and 1.51; low-concentration asymptotes, A1 = 0.94, 57, and 12.7; and high-concentration asymptotes, A2 = 2.4, 1.9, and 1.4 for A, B, andC, respectively. The horizontal dashed line in A indicates the facilitation ratio for control cells (1.1), and the vertical dashed lineindicates a theoretical injected Gβ2 DNA concentration (7.0 ng/μl) that would be equivalent to this basal facilitation ratio.