
Fig. 2.
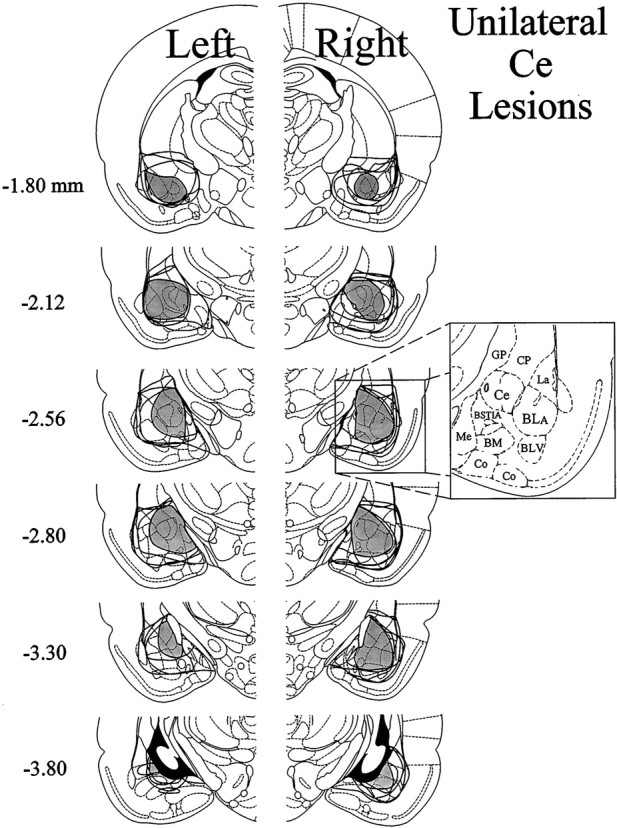
Histological results of Experiment 1: unilateral Ce lesions, morphine and contralateral formalin. Representations of six coronal sections through the rat forebrain are shown in sequence from anterior to posterior. The numbers in the left margin indicate millimeters posterior to bregma. Theclosed curves illustrate the borders of lesions that included the Ce (n = 9) in each hemisphere, as determined by the extent of neuronal cell loss and gliosis. Note that four rats had lesions placed in the left cerebral hemisphere, whereas the other five had lesions placed in the right cerebral hemisphere. The lesion area common to all rats in each hemisphere is shown asdark shading. Note that >95% of the Ce was damaged unilaterally in all nine rats. Adapted from Paxinos and Watson (1986). Amygdaloid areas: Ce, central nucleus;BLA, basolateral nucleus, anterior; BLV, basolateral nucleus, ventral; BSTIA, bed nucleus of the stria terminalis, intra-amygdaloid division; Me, medial nucleus; BM, basomedial nucleus; Co, cortical amygdaloid nuclei. Extra-amygdaloid areas: GP, globus pallidus; CP, caudate-putamen.