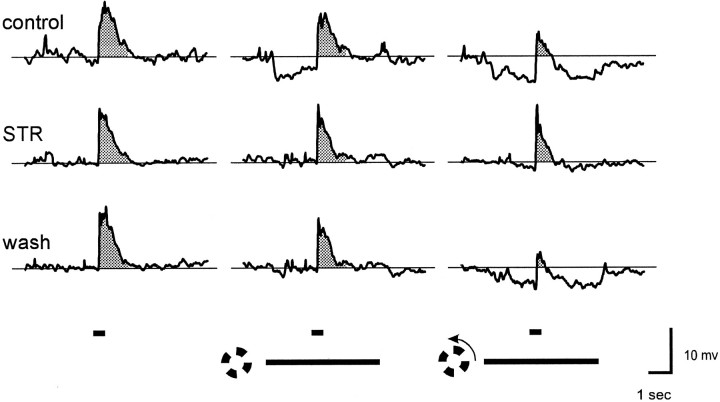
Fig. 1.
Strychnine blocks TLI in ganglion cells. Responses are from an on–off ganglion cell in tiger salamander eyecup. Each trace is the average of four to eight responses that had been filtered to eliminate action potentials (see Methods and Materials). Each of the three groups of traces shows the average response to a 400-μm-diameter spot alone (left) and in the presence of a windmill pattern (1200 μm i.d., 2600 μm o.d.) that was either stationary (middle) or rotating (right). The timing of the spot and windmill stimuli are indicated by thehorizontal bars at the bottom. Spot and windmill intensity were both 8.4 log quanta. Responses in themiddle row of traces were obtained after 5 min in 2 μm strychnine, and those in the bottom rowof traces were obtained 20 min after return to control Ringer’s solution. Resting potential in darkness was −50 mV in control Ringer’s solution and −53 mV in the presence of strychnine.

