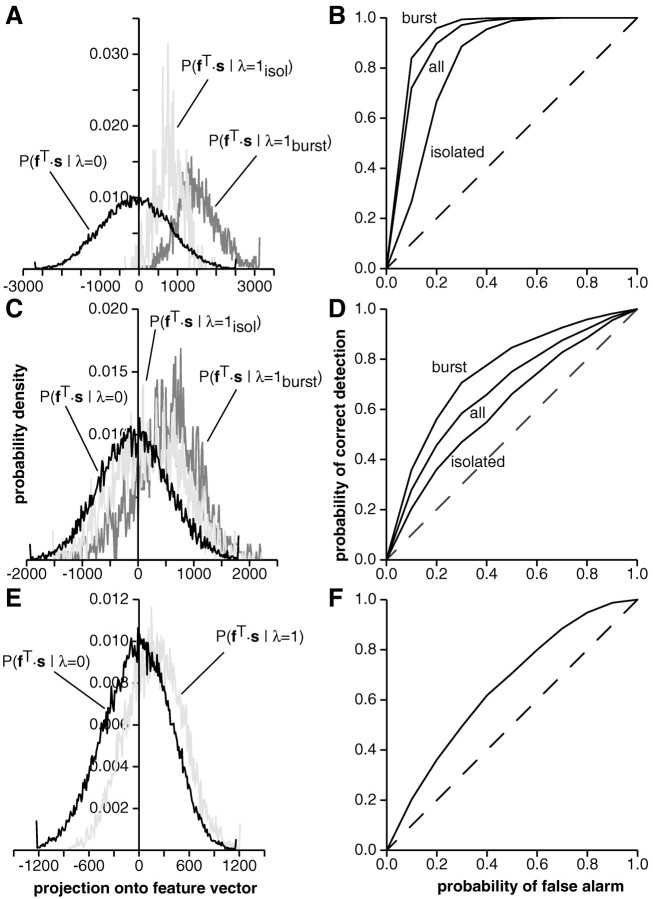
Fig. 10.
Distribution of stimuli projected onto the optimal feature vector and corresponding ROC curves for an I-type (A, B) and an E-type pyramidal cell (C, D) as well as for a P-receptor afferent (E, F).A, I-unit in CMS (Icms); same recording as in Fig. 9A. Distribution of projected stimuli occurring before a bin containing no spike (black), before an isolated spike (light gray), and before a spike belonging to a burst (dark gray). B, Corresponding ROC curve for the discrimination between the distribution of projected stimuli occurring before no spike and isolated spikes (isolated), all spikes (all), and spikes belonging to bursts (burst). The spikes occurring during burst discharges yield the best performance (εisol = 0.21, ε = 0.15, εburst = 0.12). C, D, Same plots as in A and B but for an E-unit in CMS (Ecms; stimulus parameters A0 = 5 mV/cm, fc = 18 Hz, ς = 0.4 V; bin size Δt = 7 msec; εisol = 0.42, ε = 0.36, εburst = 0.30).E, F, Distribution of projected stimuli for a P-receptor afferent occurring before a bin containing no spike (black) and a spike (light gray) (E) corresponding ROC curve (F) (stimulus parameters A0 = 1.0 mV/cm, fc = 20 Hz, ς = 0.29; bin size Δt = 1.5msec; ε = 0.39).

