
Fig. 11.
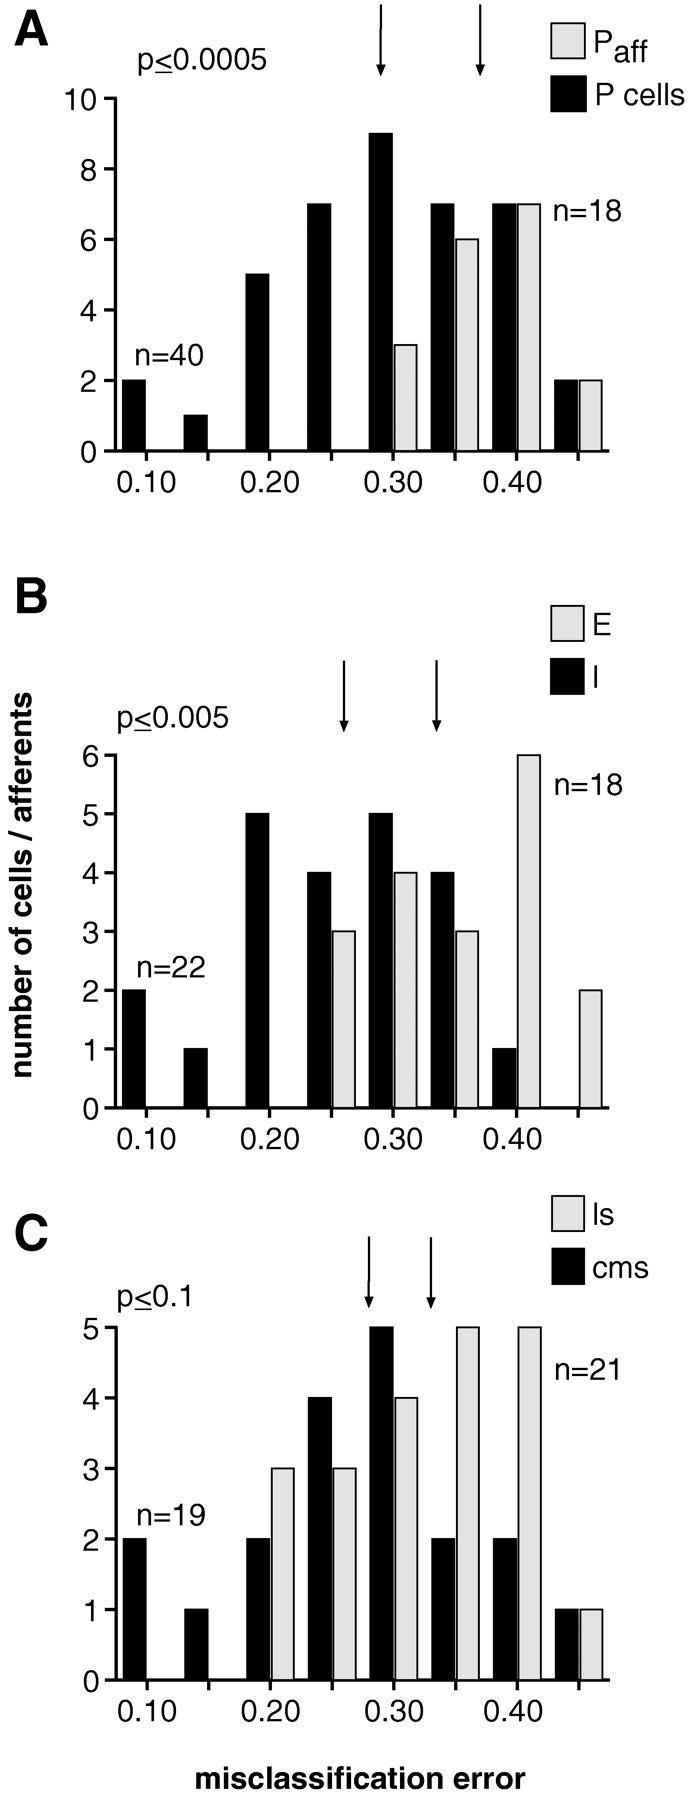
Comparison of the performance of different pyramidal cell types in various ELL maps and, in A only, of P-receptor afferents in the feature extraction task. A, Histogram of the best (lowest value across all stimulus presentations) misclassification error ε obtained for P-receptor afferents (Paff; n = 18) and both types of pyramidal cells (P cells; n = 40; only spikes belonging to bursts are taken into account). Median value of distribution for P-receptor afferents (εmedian = 0.37) and for pyramidal cells (εmedian = 0.29) are indicated by the right and left vertical arrow, respectively. Higher values of the misclassification error indicate worse performance. The difference in median values is significant at the p ≤ 0.0005 level (Wilcoxon rank sum test).B, Distributions of the misclassification error for E-type (n = 18) and I-type pyramidal cells (n= 22) from both CMS and LS combined. Median value of distribution for I-units: εmedian = 0.26 (left vertical arrow) and for E-units: εmedian = 0.34 (right vertical arrow). Significance level: p ≤ 0.005.C, Distribution of the probability of misclassification for both E- and I-type pyramidal cells combined from LS (n= 21) versus those from CMS (n = 19). Median value of distribution for cells in CMS: εmedian = 0.28 (left vertical arrow) and for cells in LS: εmedian = 0.33 (right vertical arrow). Significance level: p ≤ 0.1.