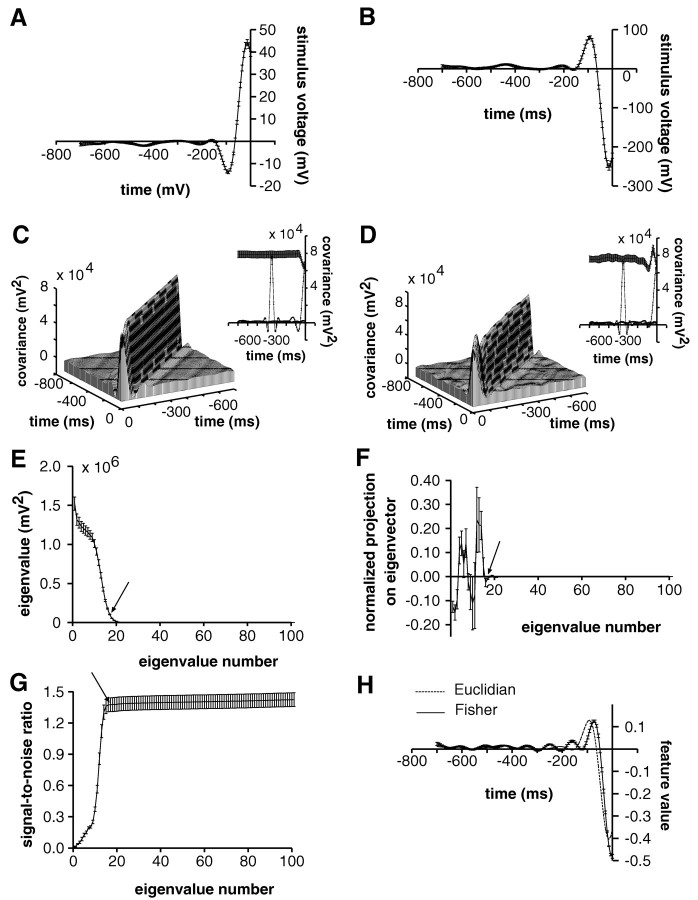
Fig. 4.
Computation of the optimal feature vectorf exemplified for an I-type pyramidal cell in LS (stimulus parameters: A0 = 1.25 mV/cm, fc = 12 Hz, ς = 0.29 V; Δt = 7 msec). A, B, Mean stimuli m0 and m1preceding no spike occurrence and a spike, respectively. In these two panels and the following ones, error bars always represent SD over 10 repetitions of the same experiment. C, D, Covariance matrices Σ0 and Σ1 of the distributions P(s‖λ = 0) and P(s‖λ = 1). Insets, Mean value and SD of the estimated covariances along the main diagonals and the t = 0 axis. E, Eigenvalues of 1/2Σ0 + 1/2Σ1 sorted in decreasing order of magnitude. In E–G, arrows indicate the last eigenvalue taken into account for the computation of f (eigenvalue number = 17). F, Normalized value of the projection ofm1 − m0 onto the eigenvectors of 1/2Σ0 + 1/2Σ1. The sum of the first 17 eigenvectors weighted by the corresponding normalized projection yields f. G, Value of the signal-to-noise ratio, SNR, as a function of the number of eigenvalues considered for the computation of f. SNR saturates when 17 eigenvectors are taken into account. Thus, eigenvectors with eigenvalue numbers larger than 17 do not contribute significantly to the discrimination performance. H, Feature vector obtained by the Fisher method (solid line) and Euclidian feature vectorf = m1 −m0 obtained directly from A andB (dashed line).

