
Fig. 7.
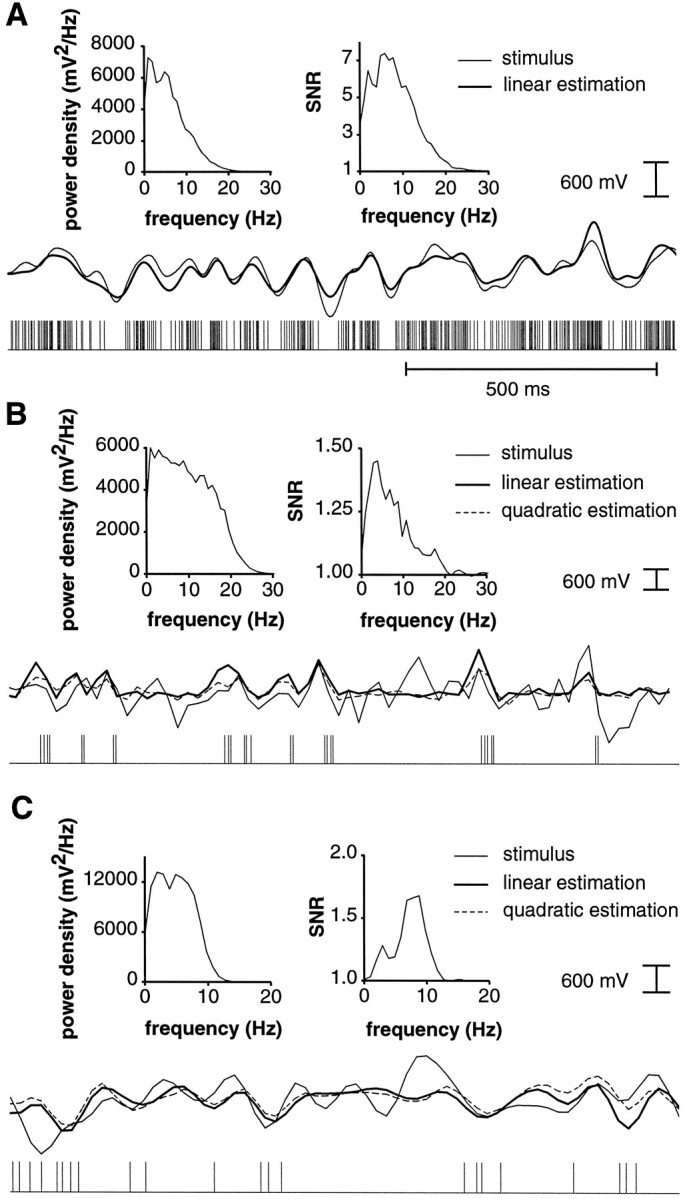
Examples of linear and quadratic stimulus estimations for responses of P-receptor afferents (A), E-type (B), and I-type pyramidal cells (C). For all three examples (A–C), spike trains are symbolized in each bottom row, the corresponding RAMs (= stimuli) are indicated in the center and superimposed with their linear, and inB and C only, quadratic estimates obtained from the spike trains. Each top row contains two graphs showing the power spectral density of the stimulus as a function of stimulus frequency (left graphs) and SNR in the frequency domain for linear estimation (right graphs). A, P-receptor afferents encoded the detailed time-course of the stimulus by modulating their instantaneous firing frequency. Note the much higher sustained firing rate than that observed in pyramidal cells (seeB and C) (mean firing rate: 221 Hz; coding fraction γ = 0.76; stimulus parameters: A0 = 1.2 mV, ς = 0.26 V, fc = 9 Hz).B, Linear and quadratic estimation for an E-type pyramidal cell from CMS (Ecms; mean firing rate: 17 Hz; γlin = 0.09; γquadr = 0.13; stimulus parameters: A0 = 3.0 mV, ς = 0.32 V,fc = 18 Hz). The stimulus was resampled at a 50 Hz sampling rate to compute the quadratic estimate (see Materials and Methods). The stimulus as well as the linear and quadratic estimates are therefore illustrated at this sampling rate. C, Same as in B for an I-type pyramidal cell from CMS (Icms; mean firing rate: 13 Hz; γlin = 0.11; γquadr = 0.15; stimulus parameters: A0 = 5.0 mV, ς = 0.34 V,fc = 9 Hz).